349989153 opened a new issue #8458: axisTick的interval似乎会自己多加一条上去 URL: https://github.com/apache/incubator-echarts/issues/8458 <!-- 为了方便我们能够复现和修复 bug,请遵从下面的规范描述您的问题。 --> ### One-line summary [问题简述] 利用x轴的axisTick和axisLabel做一些自定义修改时,发现不可控的情况。 ### Version & Environment [版本及环境] + ECharts version [ECharts 版本]: 4.1.0 + Browser version [浏览器类型和版本]: Google Chrome 版本 66.0.3359.181(正式版本) (64 位) + OS Version [操作系统类型和版本]: maxOS High Sierra 版本10.13.4 ### Expected behaviour [期望结果] x轴上,最后一根刻线不应该在“1”的右边,应该在x轴的最后。 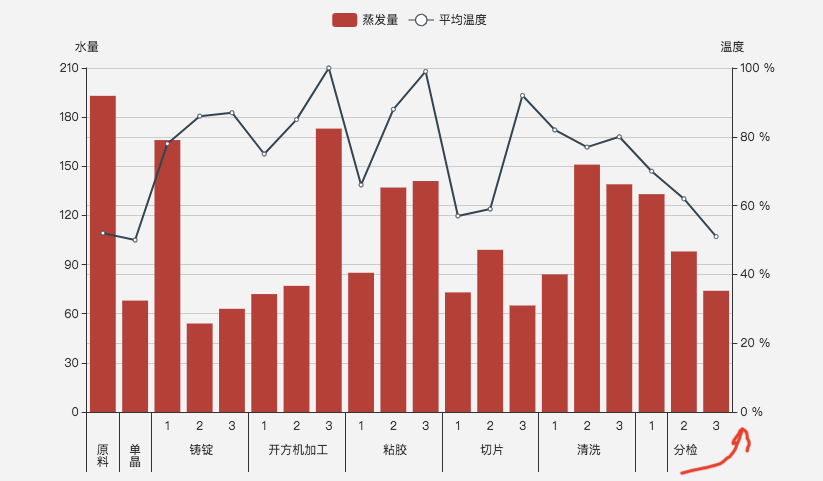 ### ECharts option [ECharts配置项] <!-- Copy and paste your 'echarts option' here. --> <!-- [下方贴你的option,注意不要删掉下方 ```javascript 和 尾部的 ``` 字样。最好是我们能够直接运行的 option。如何得到能运行的 option 参见上方的 guidelines for contributing] --> ```javascript option = { tooltip: { trigger: 'axis', axisPointer: { type: 'cross', crossStyle: { color: '#999' } } }, legend: { data:['蒸发量','降水量','平均温度'] }, xAxis: [ { type: 'category', data: [ '原料', '单晶', '铸锭1', '铸锭2', '铸锭3', '开方1', '开方2', '开方3', '粘胶1', '粘胶2', '粘胶3', '切片1', '切片2', '切片3', '清洗1', '清洗2', '清洗3', '分检1', '分检2', '分检3' ], axisPointer: { type: 'shadow' }, axisTick: { show: true, interval: function (index, val) { if (val.indexOf('原料') > -1 || val.indexOf('单晶') > -1) { return true; } if (index % 3 === 2) { return true; } return false; }, length: 100 }, axisLabel: { interval: 0, formatter: function (val) { if (val.indexOf('原料') > -1 || val.indexOf('单晶') > -1) { return '\n\n' + val.split('').join('\n') } else { var workshopNo = val.slice(-1); var workShopName = val.slice(-100, -1); if (workshopNo === '1') { return workshopNo + '\n\n ' + workShopName; } return workshopNo; } } } } ], yAxis: [ { type: 'value', name: '水量', axisLabel: { formatter: '{value}' } }, { type: 'value', name: '温度', axisLabel: { formatter: '{value} %' } } ], series: [ { name:'蒸发量', type:'bar', data:[193, 68, 166, 54, 63, 72, 77, 173, 85, 137, 141, 73, 99, 65, 84, 151, 139, 133, 98, 74] }, { name:'平均温度', type:'line', yAxisIndex: 1, data:[52, 50, 78, 86, 87, 75, 85, 100, 66, 88, 99, 57, 59, 92, 82, 77, 80, 70, 62, 51] } ] }; ``` ### Other comments [其他信息] <!-- For example: Screenshot or Online demo --> <!-- [例如,截图或线上实例 (JSFiddle/JSBin/Codepen)] --> 我们有个比较特别的x轴显示样式,x轴除了第1和第2个类目,后面的类目以3个为一组,每组两边显示刻线,中间不显示。 所以使用了xAxi的axisTick和axisLabel进行配置,axisLabel的显示没有问题,但是axisTick的显示,最后一根刻线有问题。我认为根据interval所写,x轴最后一根刻线不应该在“1”后面;要么它不显示,要么在最后面。现在看起来是echarts自动给我添加的。
----------------------------------------------------------------
This is an automated message from the Apache Git Service.
To respond to the message, please log on GitHub and use the
URL above to go to the specific comment.

For queries about this service, please contact Infrastructure at:
[email protected]


With regards,
Apache Git Services

---------------------------------------------------------------------
To unsubscribe, e-mail: [email protected]
For additional commands, e-mail: [email protected]