PinkD opened a new issue #8473: parallel图中选择数据时无法正常显示 URL: https://github.com/apache/incubator-echarts/issues/8473 <!-- 为了方便我们能够复现和修复 bug,请遵从下面的规范描述您的问题。 --> ### One-line summary [问题简述] `parallel` 图中: 当 `parallelAxis` 中的数据有多个 `type` 为 `category` 时,在图中只有选择第一组数据时才能正常显示 ### Version & Environment [版本及环境] + ECharts version [ECharts 版本]: 4.1.0 + Browser version [浏览器类型和版本]: Chrome 64Bit 64.0.3282.186 + OS Version [操作系统类型和版本]: Win10 64Bit 10.0.16299 ### Expected behaviour [期望结果] 选择每一组数据均能正常显示 ### ECharts option [ECharts配置项] <!-- Copy and paste your 'echarts option' here. --> <!-- [下方贴你的option,注意不要删掉下方 ```javascript 和 尾部的 ``` 字样。最好是我们能够直接运行的 option。如何得到能运行的 option 参见上方的 guidelines for contributing] --> ```javascript option = { color: [ '#c23531', '#91c7ae', '#dd8668' ], legend: { top: 10, data: ['北京', '上海', '广州'], itemGap: 20 }, parallelAxis: [ {dim: 0, name: schema[0].text, inverse: true, max: 31, nameLocation: 'start', type:'category'}, {dim: 1, name: schema[1].text}, {dim: 2, name: schema[2].text}, {dim: 3, name: schema[3].text}, {dim: 4, name: schema[4].text}, {dim: 5, name: schema[5].text}, {dim: 6, name: schema[6].text}, {dim: 7, name: schema[7].text, type: 'category', data: ['优', '良', '轻度污染', '中度污染', '重度污染', '严重污染']} ], parallel: { left: '5%', right: '13%', bottom: '10%', top: '20%', parallelAxisDefault: { type: 'value', name: 'AQI指数', nameLocation: 'end', nameGap: 20, nameTextStyle: { fontSize: 12 } } }, series: [ { name: '北京', type: 'parallel', lineStyle: lineStyle, data: dataBJ }, { name: '上海', type: 'parallel', lineStyle: lineStyle, data: dataSH }, { name: '广州', type: 'parallel', lineStyle: lineStyle, data: dataGZ } ] } ``` 注:以上代码来源例子 [parallel-all](http://www.echartsjs.com/gallery/editor.html?c=doc-example/parallel-all) ,并将其中的 `parallelAxis` 中的第一组数据改为 `category` 类型 ### Other comments [其他信息] <!-- For example: Screenshot or Online demo --> <!-- [例如,截图或线上实例 (JSFiddle/JSBin/Codepen)] --> 此issue与 #7805 应该为同一问题,但提供了更完整问题描述 截图: 选中第一组数据: 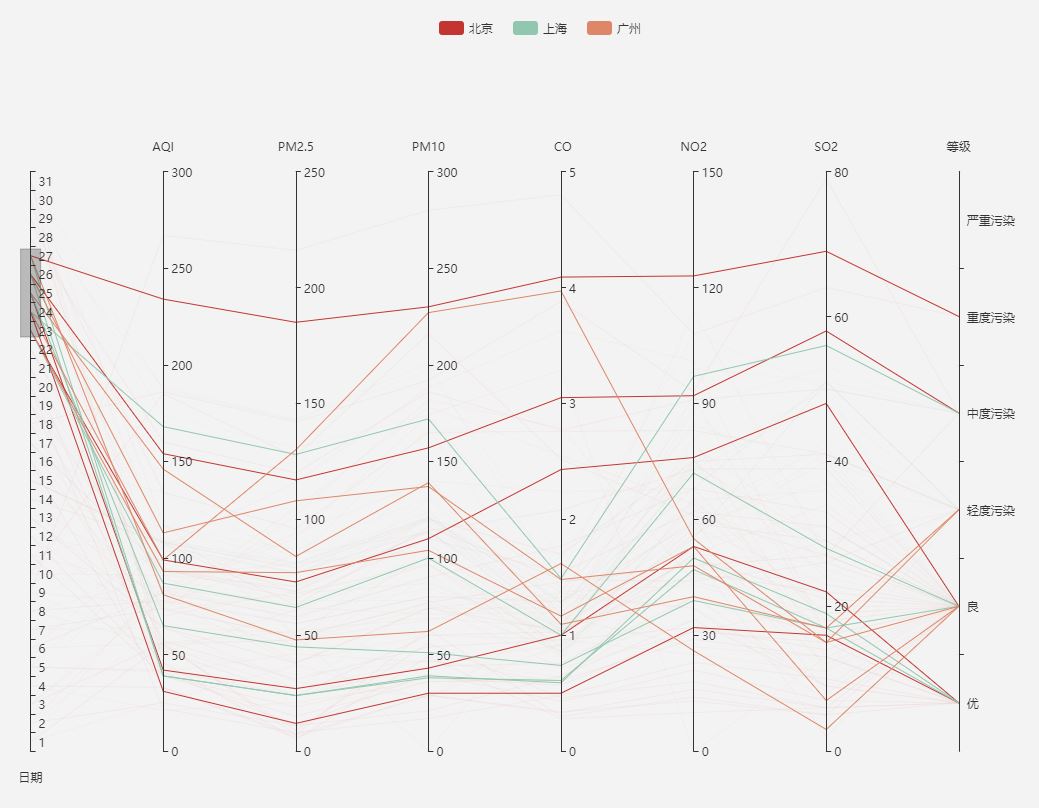 选中最后一组数据(另一组 `type` 为 `category` 的数据): 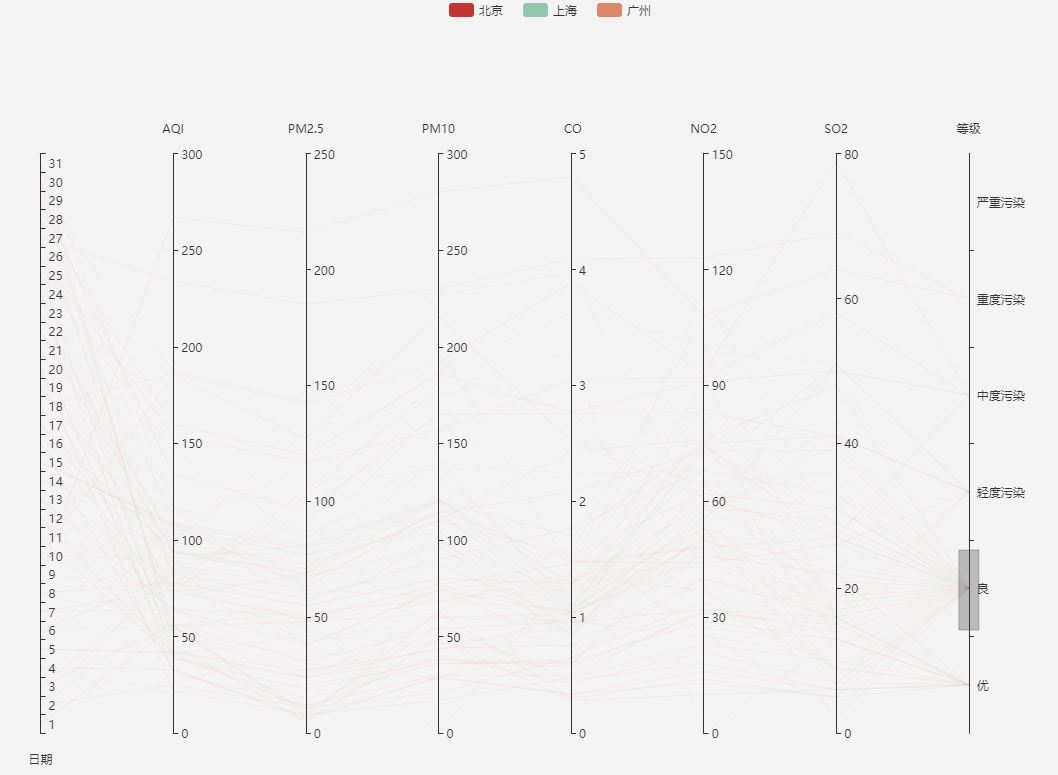
----------------------------------------------------------------
This is an automated message from the Apache Git Service.
To respond to the message, please log on GitHub and use the
URL above to go to the specific comment.

For queries about this service, please contact Infrastructure at:
[email protected]


With regards,
Apache Git Services

---------------------------------------------------------------------
To unsubscribe, e-mail: [email protected]
For additional commands, e-mail: [email protected]