EduardoBan opened a new issue #8972: Gauge, define maximum value and minimum to represent URL: https://github.com/apache/incubator-echarts/issues/8972 I want to modify the maximum and minimum values to represent, for this I use the option of: "series": min: 0 and max: 150. I use a graphic of the gallery, the url is: [http://gallery.echartsjs.com/editor.html?c=xryw3vNUll] the option code is: ``` function detectionData(str) { var color = '#5eb95e'; var Control = _ValorMax - _ValorMin; if (str >= 30 && str <= 60) { color = '#F37B1D'; } else if (str > 60) { color = '#dd514c'; } return color; } var option = { title: { "text": _Titulo, "x": '50%', "y": '0%', "textAlign": "center", "textStyle": { "fontWeight": 'normal', "fontSize": 16, "color": "#000000", }, }, "tooltip": { "formatter": "{a} <br/>{b} : {c}%" }, "series": [{ "name": "", "type": "gauge", center: ['50%', '56%'], min: 0, max: 150, radius: '62%', // Diametro del dial "splitNumber": 8, "axisLine": { "lineStyle": { "color": [ [0.01, "#F37B1D"], [1, "#e9ecf3"] ], "width": 20 //Ancho del dial } }, "axisTick": { "lineStyle": { "color": "#3bb4f2", "width": 3 }, "length": -8,//Longitud del palito del valor "splitNumber": 1 }, "axisLabel": { "distance": -60,// Distancia adonde pone los valores "textStyle": { "color": "#000" } }, "splitLine": { "show": false }, "itemStyle": { "normal": { "color": "#494f50" } }, "detail": { "formatter": "{value}"+ _Unidad, "offsetCenter": [0, "60%"], "textStyle": { "fontSize": 16, "color": "#F37B1D" } }, "title": { "offsetCenter": [0, "100%"] }, "data": [{ "name": _NombreSerie, "value": _Valor }] }] } var ChartGauge = echarts.init(document.getElementById(_NombreRep)); timeTicket = setInterval(function (){ var amplitud = _Valor.valor; amplitud = amplitud * (Math.random().toFixed(2)-0)*4.5>>0; // lo roto a la dercha >>0 para sacar los decimales option.series[0].data[0].value = amplitud; option.series[0].axisLine.lineStyle.color[0][0] = (amplitud) / 100; option.series[0].axisLine.lineStyle.color[0][1] = detectionData(amplitud); ChartGauge.setOption(option, true); }, 2000) ``` The image obtained is: 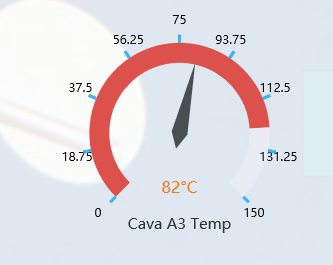 The problem that the filled area does not accompany the indicator dial, the fault occurs if I change the min as the max. if I put them in min = 0 and max = 100 (default) it works correctly. How could I fix this problem? ### Version & Environment [版本及环境] + ECharts version [ECharts 版本]: 4 + Browser version [浏览器类型和版本]:All + OS Version [操作系统类型和版本]:Windows 10
----------------------------------------------------------------
This is an automated message from the Apache Git Service.
To respond to the message, please log on GitHub and use the
URL above to go to the specific comment.

For queries about this service, please contact Infrastructure at:
[email protected]


With regards,
Apache Git Services

---------------------------------------------------------------------
To unsubscribe, e-mail: [email protected]
For additional commands, e-mail: [email protected]