syntacticsolutions opened a new issue #9198: Line Chart sometimes doesn't render properly. URL: https://github.com/apache/incubator-echarts/issues/9198 <!-- 为了方便我们能够复现和修复 bug,请遵从下面的规范描述您的问题。 --> ### One-line summary [问题简述] Line Chart sometimes doesn't render properly 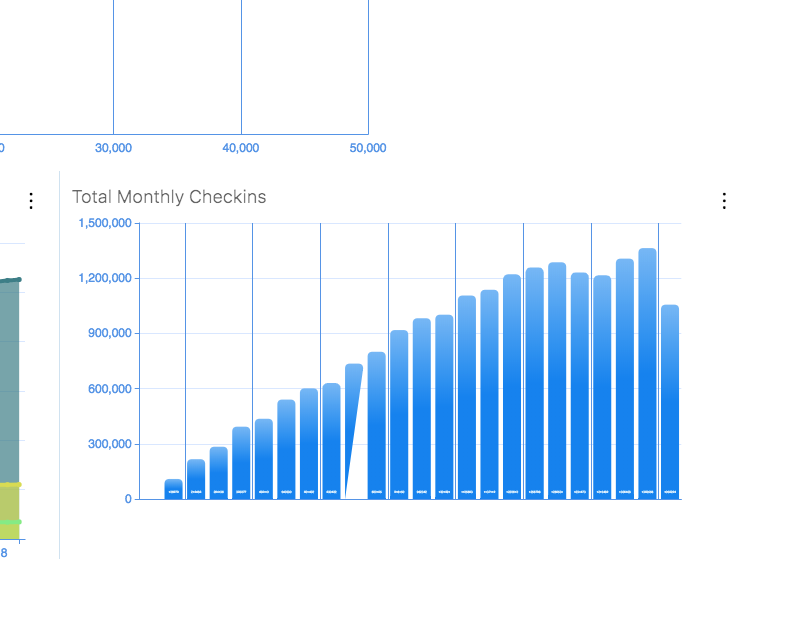 ### Version & Environment [版本及环境] + ECharts version [ECharts 版本]: 4.1.0 + Browser version [浏览器类型和版本]: Latest Chrome + OS Version [操作系统类型和版本]: Latest High Sierra ### Expected behaviour [期望结果] All of the bars should be full and extend from the bottom to the top of it's value. ### ECharts option [ECharts配置项] <!-- Copy and paste your 'echarts option' here. --> <!-- [下方贴你的option,注意不要删掉下方 ```javascript 和 尾部的 ``` 字样。最好是我们能够直接运行的 option。如何得到能运行的 option 参见上方的 guidelines for contributing] --> ```javascript let option = { tooltip: this.tooltip, // title: _.extend({ text: this.contents.title }, this.title), legend: this.contents.origLegend ? { data: this.contents.yVals, itemWidth: 20, width: this.contents.report ? 1000 : '100%', bottom: this.contents.report ? 24 : this.contents.origLegend ? null : -7, top: this.contents.origLegend ? -4 : null, left: 25, align: 'left', type: 'scroll', show: this.colors.length } : null, // _.extend({ data: this.contents.yVals }, this.legend), grid: { left: !this.colors.length ? '140' : this.contents.report ? '100' : '40', right: 30, bottom: this.contents.report ? 60 : 20, top: this.contents.report ? 60 : this.contents.origLegend ? 30 : 5 }, dataView: { lang: ['en-US'] }, // dataZoom: [ // { // show: !this.contents.report // } // ], xAxis: { type: 'category', // name: this.contents.xVal, // nameLocation: 'middle', nameTextStyle: { }, nameGap: this.contents.report ? 35 : 15, data: this.xList, stack: 'something', boundaryGap: true, splitLine: { show: false, interval: 'auto', lineStyle: { color: ['#D4DFF5'] } }, axisTick: { show: true }, axisLine: { show: true, lineStyle: { color: '#609ee9' } }, axisLabel: { show: true, // margin: 10, textStyle: { fontSize: 12 }, formatter: val => val.dtToDate() } }, yAxis: { type: 'value', name: this.contents.yVal, offset: -5, splitLine: { show: true, lineStyle: { color: ['rgba(0,100,255, 0.15)'] } }, axisTick: { show: true }, axisLine: { lineStyle: { color: '#609ee9' }, show: true, margin: -40, interval: 100 }, axisLabel: { show: true, textStyle: { fontSize: 10 } } }, series: this.yTrends.map(((arr, i) => ({ name: this.contents.yVals[i], type: 'line', smooth: true, showSymbol: true, areaStyle: this.areaStyle, symbol: 'circle', symbolSize: 5, data: arr, itemStyle: { normal: { color: this.colors[i] || 'transparent' } }, lineStyle: { normal: { width: 4 } } }))) ``` ### Other comments [其他信息] <!-- For example: Screenshot or Online demo --> <!-- [例如,截图或线上实例 (JSFiddle/JSBin/Codepen)] -->
----------------------------------------------------------------
This is an automated message from the Apache Git Service.
To respond to the message, please log on GitHub and use the
URL above to go to the specific comment.

For queries about this service, please contact Infrastructure at:
[email protected]


With regards,
Apache Git Services

---------------------------------------------------------------------
To unsubscribe, e-mail: [email protected]
For additional commands, e-mail: [email protected]