cnyb-kwange opened a new issue #9228: Echarts配置项itemStyle失效现象 URL: https://github.com/apache/incubator-echarts/issues/9228 ### One-line summary [问题简述] > series -> data -> itemStyle -> color & borderColor 失效 通过option下的series数组里配置5个系列来自定义业务需求图表。 每个系列的data里又配置itemStyle来定义当前系列样式,主要color和borderColor。 本地运行时一切正常,放到线上运行一段时间之后所有系列的color和borderColor配置失效。 自定义业务需求图表是每过5秒钟重新渲染 —— 每次生成新的option,再通过 setOption API 进行渲染。 补充:生成option之前准备工作量(业务相关计算)比较大。 ### Version & Environment [版本及环境] + ECharts version [ECharts 版本]: 4.0.4 + Browser version [浏览器类型和版本]: Chrome 版本 65.0.3325.181(正式版本) (64 位) + OS Version [操作系统类型和版本]: Windows 7 旗舰版 版本 6.1 (内部版本 7601:Service Pack 1) ### Expected behaviour [期望结果] Echarts配置项itemStyle不失效 ### ECharts option [ECharts配置项] <!-- Copy and paste your 'echarts option' here. --> <!-- [下方贴你的option,注意不要删掉下方 ```javascript 和 尾部的 ``` 字样。最好是我们能够直接运行的 option。如何得到能运行的 option 参见上方的 guidelines for contributing] --> ```javascript var innerPoints = []; for(var i = 0; i < 1000; i++) { innerPoints.push({ custom: { data: [ {key: '时间', value: '2016-01-20'}, {key: '坐标', value: '(30, 200)'} ] }, value: [Math.random() * -900, Math.random() * 8000], itemStyle: {color: '#01de07'}, tooltip: { formatter: function (param) { let html = '<ul style="padding:6px;list-style:none;margin:0;">'; param.data.custom.data.forEach((item) => { html += `<li style="display:flex;justify-content:space-between;line-height:22px;">${item.key}<em style="margin-left:24px;color:${param.color};font-size:14px;font-style:normal;font-family:'segoeuil';">${item.value}</em></li>`; }); return html += '</ul>'; } } }); } option = { backgroundColor: '#07133E', grid: { top: 20, right: 20, bottom: 20, left: 20, containLabel: true }, tooltip: { trigger: 'item', axisPointer: { lineStyle: { color: 'rgba(255,255,255,0)' } }, useHTML: true, position: function (pos) { return { left: pos[0] + 20, top: pos[1] - 70 } }, backgroundColor: 'rgba(3,9,20,.85)' }, xAxis: { type: 'value', splitNumber: 10, axisTick: { length: 0 }, axisLabel: { color: 'rgba(255,255,255,.7)' }, axisLine: { lineStyle: { color: '#565E7C' } }, splitLine: { lineStyle: { type: 'dashed', color: 'rgba(255,255,255,.15)' } } }, yAxis: { type: 'value', splitNumber: 10, axisTick: { length: 0 }, axisLabel: { color: 'rgba(255,255,255,.7)' }, axisLine: { lineStyle: { color: '#565E7C' } }, splitLine: { lineStyle: { type: 'dashed', color: 'rgba(255,255,255,.15)' } } }, series: [{ name: '坐标轴范围', type: 'line', lineStyle: { color: 'transparent' }, symbolSize: 0, data: [{ custom: { target: 'range' }, value: [-1000, -1000] }, { custom: { target: 'range' }, value: [1000, 1000] }] }, { name: '圆内点', type: 'line', lineStyle: { color: 'transparent' }, symbol: 'circle', symbolSize: 5, data: innerPoints, z: 3 }, { name: '圆1圆2', type: 'line', lineStyle: { color: 'transparent' }, symbol: 'circle', animation: false, data: [{ value: [-200, 400], symbolSize: 300, // 半径300px itemStyle: { color: 'transparent', borderColor: '#ffff00' }, tooltip: {show: false}, cursor: 'default' }, { value: [-100, 350], symbolSize: 290, itemStyle: { color: 'transparent', borderColor: '#00a0e9' }, tooltip: {show: false}, cursor: 'default' }] }, { name: '直线1', type: 'line', symbol: 'circle', itemStyle: { color: '#ffff00' }, lineStyle: { color: '#ffff00' }, animation: false, data: [{ custom: { name: '初始刚度圆', color: '#ffff00', data: [ {key: '时间', value: '2018-06-21'}, {key: '坐标', value: '(-200 , 400)'}, {key: '初始半径', value: '300°'} ] }, value: [-200, 400], symbolSize: 5, tooltip: { formatter: function (param) { let html = '<ul style="padding:6px;list-style:none;margin:0;">'; html += `<li style="line-height:22px;text-align: center;"><em style="color:${param.data.custom.color};font-size:14px;font-style:normal;font-family:'segoeuil';">${param.data.custom.name}</em></li>`; param.data.custom.data.forEach((item) => { html += `<li style="display:flex;justify-content:space-between;line-height:22px;">${item.key}<em style="margin-left:24px;color:${param.color};font-size:14px;font-style:normal;font-family:'segoeuil';">${item.value}</em></li>`; }); return html += '</ul>'; } }, cursor: 'pointer' }, { custom: { target: 'origin' }, value: [0, 0], symbolSize: 0 }], z: 3 }, { name: '直线2', type: 'line', symbol: 'circle', itemStyle: { color: '#00a0e9' }, lineStyle: { color: '#00a0e9' }, animation: false, data: [{ custom: { name: '当前刚度圆', color: '#00a0e9', data: [ {key: '时间', value: '2018-06-21'}, {key: '坐标', value: '(-100 , 350)'}, {key: '当前半径', value: '290°'}, {key: '变形比', value: '96.7%'} ] }, value: [-100, 350], symbolSize: 5, tooltip: { formatter: function (param) { let html = '<ul style="padding:6px;list-style:none;margin:0;">'; html += `<li style="line-height:22px;text-align: center;"><em style="color:${param.data.custom.color};font-size:14px;font-style:normal;font-family:'segoeuil';">${param.data.custom.name}</em></li>`; param.data.custom.data.forEach((item) => { html += `<li style="display:flex;justify-content:space-between;line-height:22px;">${item.key}<em style="margin-left:24px;color:${param.color};font-size:14px;font-style:normal;font-family:'segoeuil';">${item.value}</em></li>`; }); return html += '</ul>'; } }, cursor: 'pointer' }, { custom: { target: 'origin' }, value: [0, 0], symbolSize: 0 }], z: 3 }] }; ``` ### Other comments [其他信息] <!-- For example: Screenshot or Online demo --> <!-- [例如,截图或线上实例 (JSFiddle/JSBin/Codepen)] --> 正常如下: 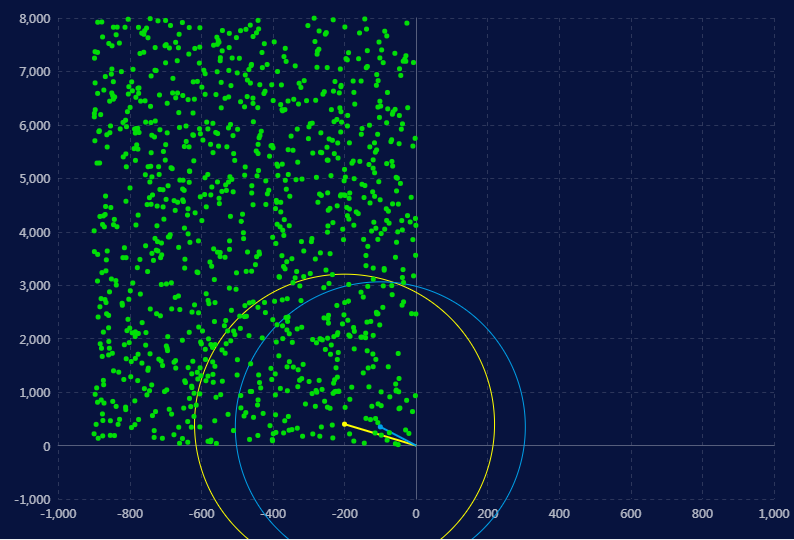 不正常如下: 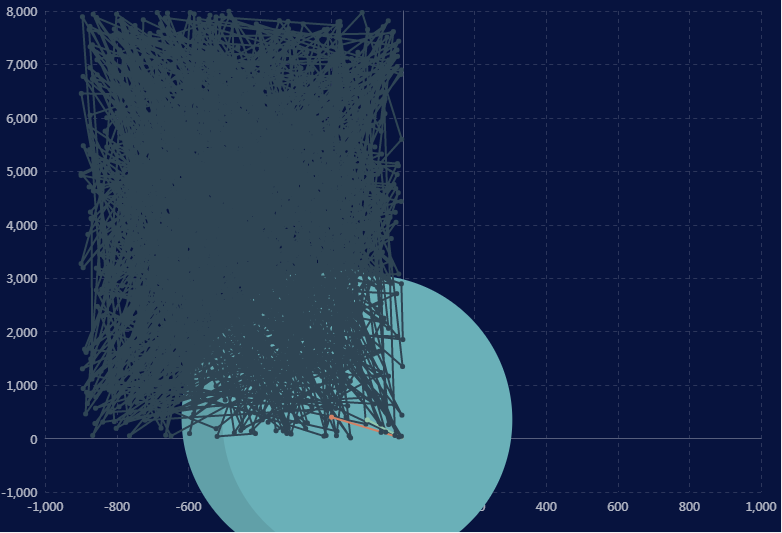
----------------------------------------------------------------
This is an automated message from the Apache Git Service.
To respond to the message, please log on GitHub and use the
URL above to go to the specific comment.

For queries about this service, please contact Infrastructure at:
[email protected]


With regards,
Apache Git Services

---------------------------------------------------------------------
To unsubscribe, e-mail: [email protected]
For additional commands, e-mail: [email protected]