mhxy13867806343 opened a new issue #9229: 折线图刷新后不一定能显示 URL: https://github.com/apache/incubator-echarts/issues/9229 ###One-line summary [问题简述] 使用的技术是纯html+jquery编写的图形方式,加载页面后,echarts生成的折线图,会显示不出来,通过如下代码 series:[ { name:'', type:'line', data:[120, 132, 5101, 3134, 90, 2230, 1210,4000,8000,1000,18000,24000] }, { name:'', type:'line', stack: '总量', normal: { show: true, position: 'top' }, data:[220, 182, 4191, 22234, 12290, 3130, 2310] } ] 生成数据 ### Version & Environment [版本及环境] + ECharts version [ECharts 版本]:4.2.1 + Browser version [浏览器类型和版本]:Google Chrome 已是最新版本版本 69.0.3497.100(正式版本) (64 位) + OS Version [操作系统类型和版本]: Windows 7 旗舰版 版本 6.1 (内部版本 7601:Service Pack 1) ### Expected behaviour [期望结果] 当页面加载后,能够显示在页面上,并且刷新后依然还在 ### ECharts option [ECharts配置项] <!-- Copy and paste your 'echarts option' here. --> <!-- [下方贴你的option,注意不要删掉下方 ```javascript 和 尾部的 ``` 字样。最好是我们能够直接运行的 option。如何得到能运行的 option 参见上方的 guidelines for contributing] --> ```javascript 我编写的代码 function line(){ var line=document.getElementById('echartContainer'); var lines=echarts.init(line); var arrListMouth=[] for(var i=1;i<13;i++){ arrListMouth.push(`${i}月`) } lines.setOption({ title:{ text:'2018年线路销售量折线统计图', x:'center', textStyle: { fontSize:24, color:'#6e6e6e' } }, tooltip: { trigger: 'axis', axisPointer:{ type:'cross', label: { backgroundColor:"#6a7985", formatter: function (params) { return `${params.value}的销售量为${params.seriesData.length? ':' + params.seriesData[0].data : ''} ;` } } } }, legend:{ data: [], y:'bottom' }, markPoint:{ data: [ { type: 'max', name: '最大值' }, { type: 'min', name: '最小值' } ] }, toolbox:{ feature: { saveAsImage: { show: true }, //导出图片 dataView: { show: true }, //数据视图 magicType: { //动态类型切换 type: [ 'line', 'bar' ] }, dataZoom: { show: true }, //数据区域缩放 restore: { show: true }, //重置 } }, grid:{ left: '3%', right: '4%', bottom: '3%', containLabel: true }, calculable: true, xAxis:[ { type:'category', boundaryGap:false, data:arrListMouth, } ], yAxis:[ { type:'value', name:'' } ], series:[ { name:'', type:'line', data:[120, 132, 5101, 3134, 90, 2230, 1210,4000,8000,1000,18000,24000] }, { name:'', type:'line', stack: '总量', normal: { show: true, position: 'top' }, data:[220, 182, 4191, 22234, 12290, 3130, 2310] } ] }) } ``` ### Other comments [其他信息] <!-- For example: Screenshot or Online demo --> <!-- [例如,截图或线上实例 (JSFiddle/JSBin/Codepen)] --> 正常显示的 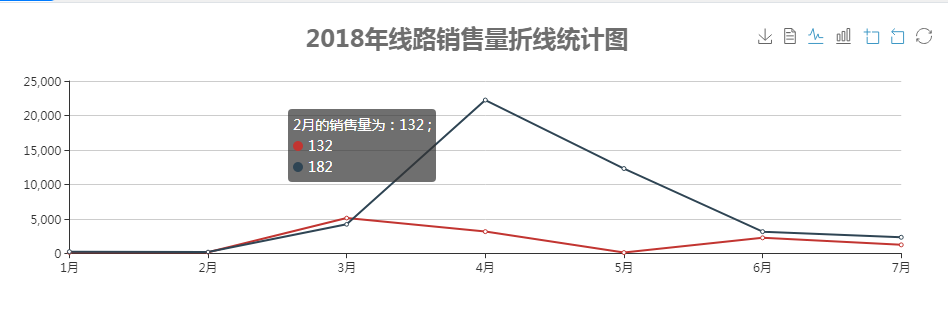 非正常显示(红色部分标记) 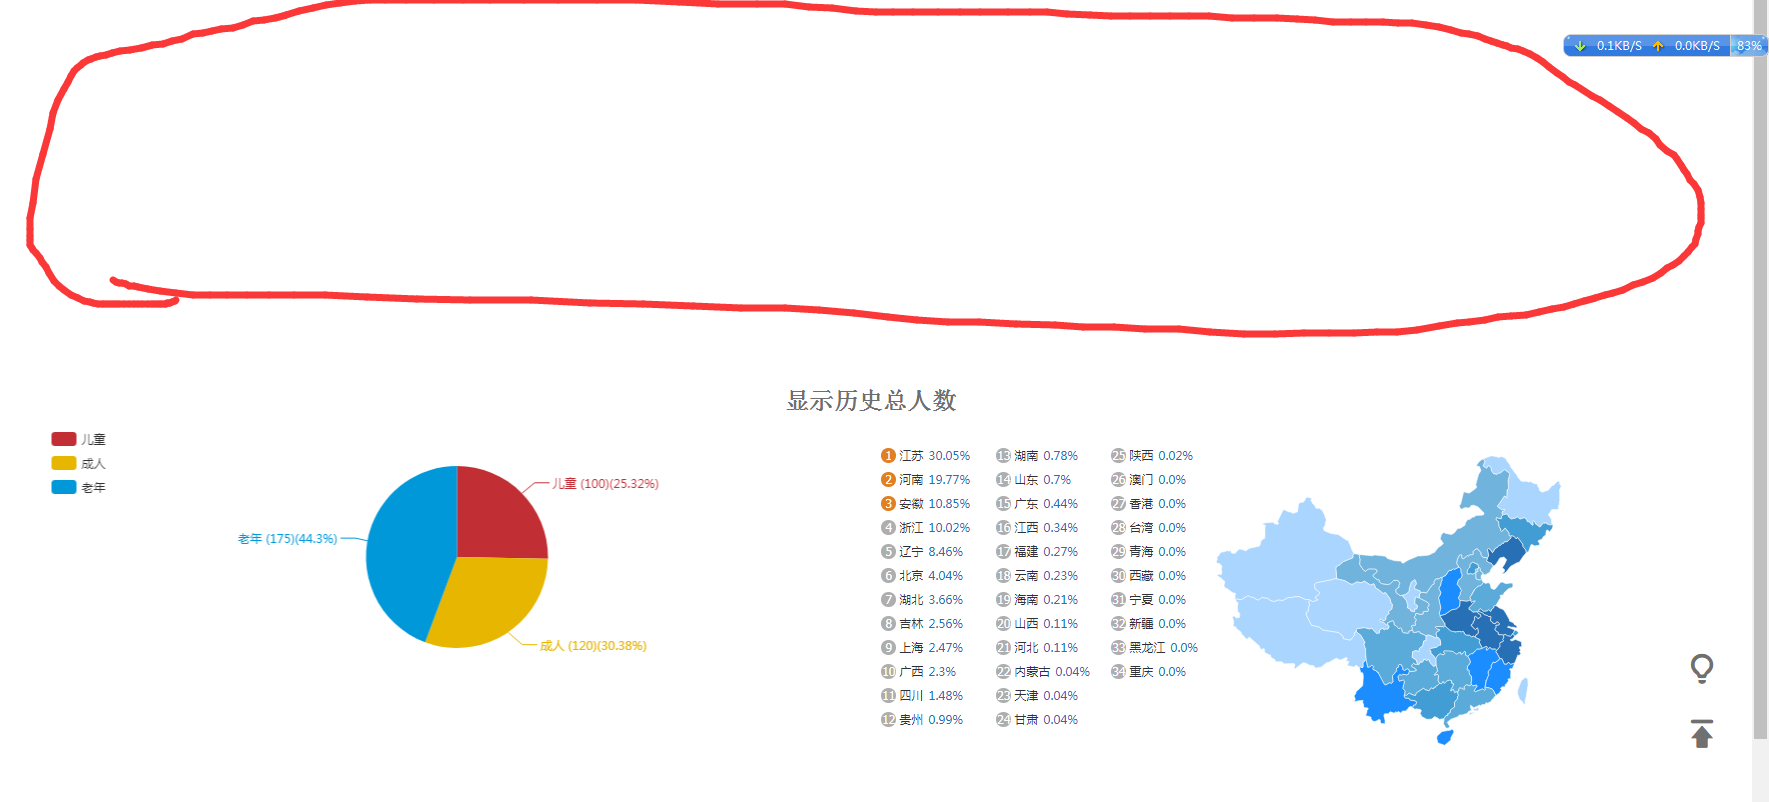
----------------------------------------------------------------
This is an automated message from the Apache Git Service.
To respond to the message, please log on GitHub and use the
URL above to go to the specific comment.

For queries about this service, please contact Infrastructure at:
[email protected]


With regards,
Apache Git Services

---------------------------------------------------------------------
To unsubscribe, e-mail: [email protected]
For additional commands, e-mail: [email protected]