DelBlank opened a new issue #9330: graphGL 首次渲染后缩放比例问题 URL: https://github.com/apache/incubator-echarts/issues/9330 ### 问题描述: 希望图表布局稳定后能**自动**呈现一个比较恰当的缩放比例 ### 现状:  ### 期望效果: 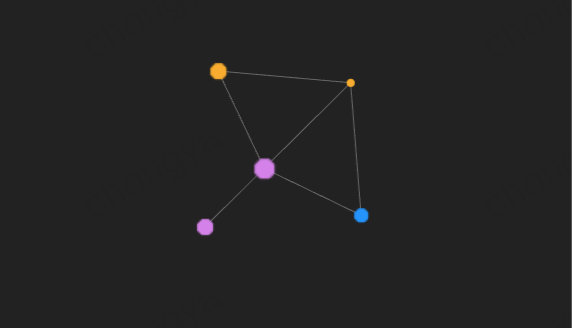 ### 版本 echarts: v4.1.0 echarts-gl: v1.1.1 chrome: v70.0.3 os: mac10.12.3 ### 代码 ```js import echarts from 'echarts' import 'echarts-gl' const options = { backgroundColor: '#222', series: [{ type: 'graphGL', symbolSize: value => value || Math.random() * 15, nodes: [...], edges: [....] }] } const graph = echarts.init(document.getElementById('graph')) graph.setOption(options) ``` ```html <div id='graph' style={{width: '100%', height: '100vh'}}></div> ```
----------------------------------------------------------------
This is an automated message from the Apache Git Service.
To respond to the message, please log on GitHub and use the
URL above to go to the specific comment.

For queries about this service, please contact Infrastructure at:
[email protected]


With regards,
Apache Git Services

---------------------------------------------------------------------
To unsubscribe, e-mail: [email protected]
For additional commands, e-mail: [email protected]