jinriwen opened a new issue #9524: 如何在多个grid中分别显示tooltip问题
URL: https://github.com/apache/incubator-echarts/issues/9524
 
 
   代码:
   > option = {
        tooltip: {
                   trigger: 'axis',
                   axisPointer: {
                       type: 'cross'
                   },
                   backgroundColor: 'rgba(245, 245, 245, 0.8)',
                   borderWidth: 1,
                   borderColor: '#ccc',
                   padding: 10,
                   textStyle: {
                       color: '#000'
                   }
               },
               axisPointer: {
                   link: { xAxisIndex: 'all' },
                   label: {
                       backgroundColor: '#777'
                   }
               },
       grid: [{
                       left: '3%',
                       right: '4%',
                       bottom: 30,
                       height: 90
                   }, {
                       left: '3%',
                       right: '4%',
                       bottom: 150,
                       height: 90
                   }, {
                       left: '3%',
                       right: '4%',
                       bottom: 270,
                       height: 90
                   }, {
                       left: '3%',
                       right: '4%',
                       bottom: 410,
                       height: 90
                   }, {
                       left: '3%',
                       right: '4%',
                       bottom: 530,
                       height: 90
                   }],
      xAxis: [{
                       type: 'category',
                       boundaryGap: false,
                       data: ['一', '二', '三', '四', '五', '六', '日']
                   }, {
                       type: 'category',
                       boundaryGap: false,
                       data: ['一', '二', '三', '四', '五', '六', '日'],
                       gridIndex: 1
                   }, {
                       type: 'category',
                       boundaryGap: false,
                       data: ['一', '二', '三', '四', '五', '六', '日'],
                       gridIndex: 2
                   }, {
                       type: 'category',
                       boundaryGap: false,
                       data: ['一', '二', '三', '四', '五', '六', '日'],
                       gridIndex: 3
                   },
                   {
                       type: 'category',
                       boundaryGap: false,
                       data: ['一', '二', '三', '四', '五', '六', '日'],
                       gridIndex: 4
                   }],
       yAxis: [{
                       type: 'value',
                       axisTick: {
                           show: false
                       },
                       splitLine: {
                           show: false
                       },
                       interval: 10000
                   }, {
                       type: 'value',
                       gridIndex: 1,
                       axisTick: {
                           show: false
                       },
                       splitLine: {
                           show: false
                       },
                       interval: 10000
                   }, {
                       type: 'value',
                       gridIndex: 2,
                       axisTick: {
                           show: false
                       },
                       splitLine: {
                           show: false
                       },
                       interval: 10000
                   }, {
                       type: 'value',
                       gridIndex: 3,
                       axisTick: {
                           show: false
                       },
                       splitLine: {
                           show: false
                       },
                       interval: 10000
                   }, {
                       type: 'value',
                       gridIndex: 4,
                       axisTick: {
                           show: false
                       },
                       splitLine: {
                           show: false
                       },
                       interval: 10000
                   }],
      series: [
                       {
                           name: 'mail',
                           type: 'line',
                           data: [10, 80, 40, 60, 30, 50, 70],
                           xAxisIndex: 0,
                           yAxisIndex: 0
                       },
                       {
                           name: 'ad',
                           type: 'line',
                           data: [80, 40, 60, 30, 50, 70, 10],
                           xAxisIndex: 1,
                           yAxisIndex: 1
                       },
                       {
                           name: 'vadio',
                           type: 'line',
                           data: [40, 60, 30, 50, 70, 10, 80],
                           xAxisIndex: 2,
                           yAxisIndex: 2
                       },
                       {
                           name: '访问',
                           type: 'line',
                           data: [60, 30, 50, 70, 10, 80, 40],
                           xAxisIndex: 3,
                           yAxisIndex: 3
                       },
                       {
                           name: 'search',
                           type: 'line',
                           data: [30, 50, 70, 10, 80, 40, 60],
                           xAxisIndex: 4,
                           yAxisIndex: 4
                       }
                   ]
   };
   
   
![20181205103838](https://user-images.githubusercontent.com/45612790/49485907-fa610f00-f87f-11e8-8085-ea455db8635c.png)
   
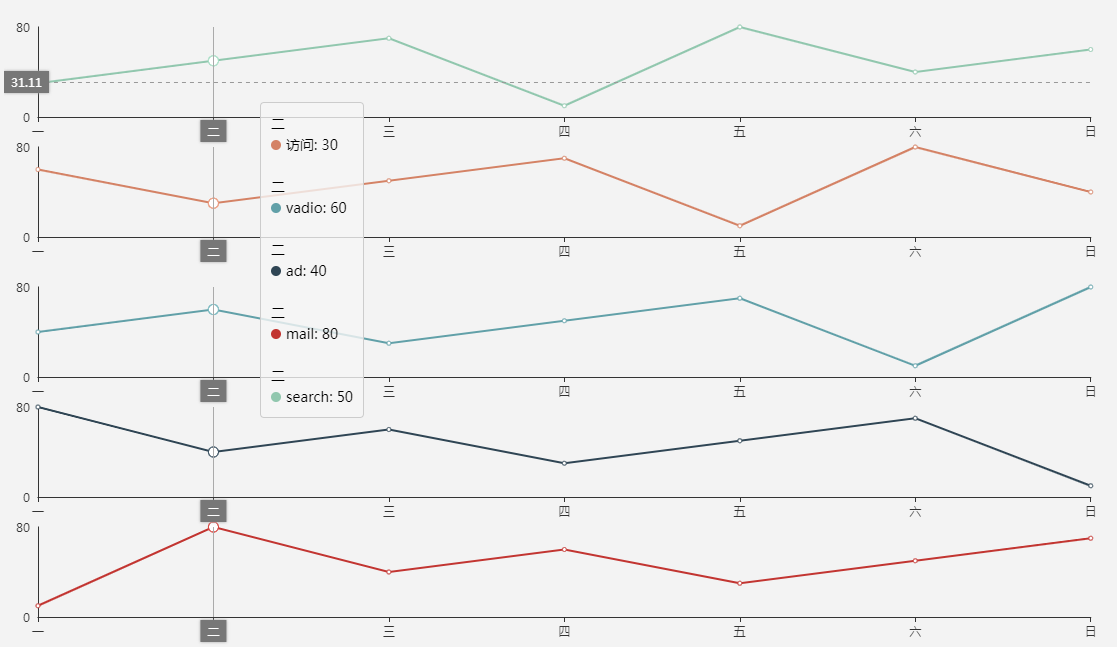
   _你好,如上图:
   
   
描述:上图的chart由多个grid的组成,图中纵坐标等于为'二'处有一条贯穿所有grid的Y线,Y线与grid中的数据交叉时,会出现tooltip,tooltip中显示Y线与所有grid的相交点数据.
   
   
问题:我想要实现如下效果,当贯穿线Y线与所有grid的数据相交时,每个相交点右侧有属于自己独有的tooltip,在属于每个交点自己独有的tooltip中,只显示Y线与自己的交点的数据.(具体效果如下图)_
   
![echarts3](https://user-images.githubusercontent.com/45612790/49485289-ba009180-f87d-11e8-857d-9ad2b3d1b656.png)
   

----------------------------------------------------------------
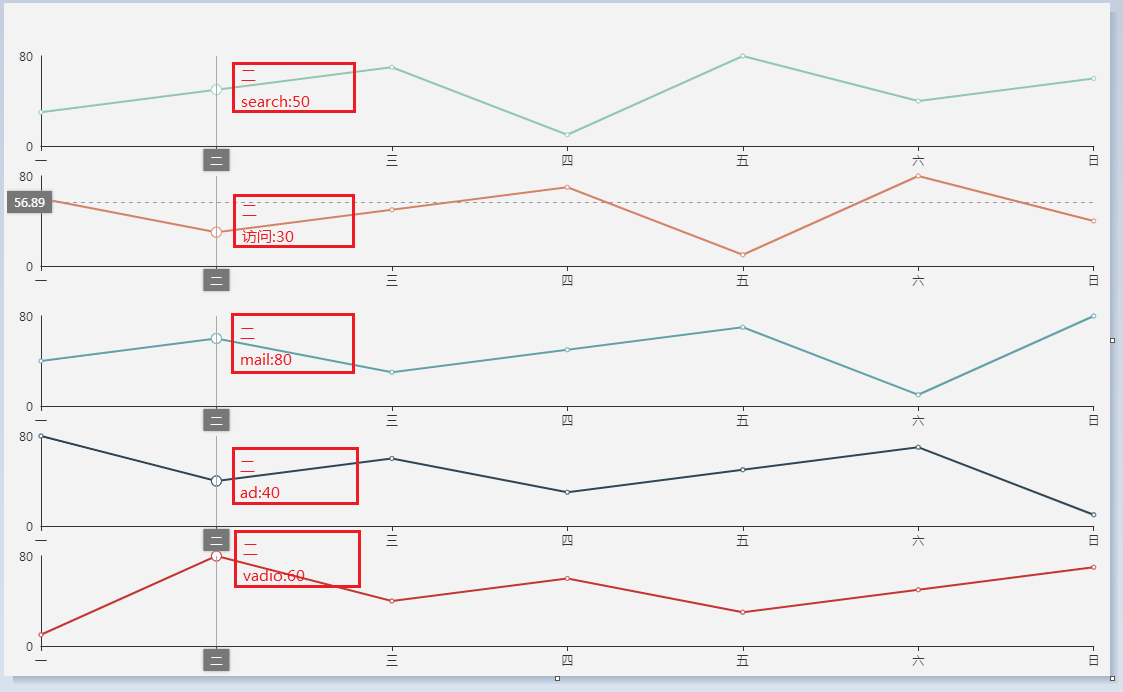
This is an automated message from the Apache Git Service.
To respond to the message, please log on GitHub and use the
URL above to go to the specific comment.
 
For queries about this service, please contact Infrastructure at:
[email protected]


With regards,
Apache Git Services

---------------------------------------------------------------------
To unsubscribe, e-mail: [email protected]
For additional commands, e-mail: [email protected]

Reply via email to