ZhongMingKun commented on issue #9752: yAxis[i].axisLabel.rich.<user defined style name>.verticalAlign不生效 URL: https://github.com/apache/incubator-echarts/issues/9752#issuecomment-454282807 > @ZhongMingKun please provide a picture to show me the expected effect you want. ### I want to reproduce the chart like image with Echarts. The image is from tushuo. https://tushuo.baidu.com/p.php?p=dta90t3y3zvla0wks (password: hz73) 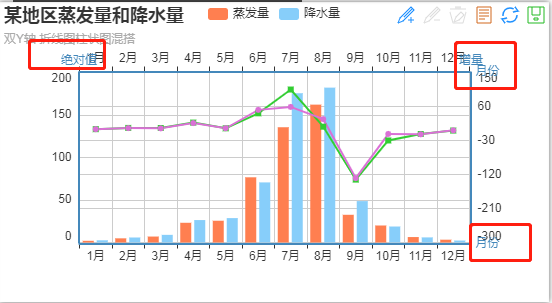 ``` option = { title: { text: "某地区蒸发量和降水量", subtext: "双Y轴 折线图柱状图混搭" }, tooltip: { trigger: "axis" }, legend: { data: ["蒸发量", "降水量"] }, toolbox: { show: true, feature: { mark: { show: true }, dataView: { show: true, readOnly: false }, restore: { show: true }, saveAsImage: { show: true } } }, calculable: true, xAxis: [ { type: "category", axisLine: { onZero: false }, data: ["1月", "2月", "3月", "4月", "5月", "6月", "7月", "8月", "9月", "10月", "11月", "12月"], name: "月份" }, { type: "category", axisLine: { onZero: false }, data: ["1月", "2月", "3月", "4月", "5月", "6月", "7月", "8月", "9月", "10月", "11月", "12月"], name: "月份", nameLocation: "end" } ], grid: { y: 70 }, yAxis: [ { type: "value", name: "绝对值" }, { type: "value", name: "增量", min: -300, max: 150 } ], series: [ { name: "蒸发量", type: "bar", data: [2, 4.9, 7, 23.2, 25.6, 76.7, 135.6, 162.2, 32.6, 20, 6.4, 3.3], xAxisIndex: 0 }, { name: "降水量", type: "bar", data: [2.6, 5.9, 9, 26.4, 28.7, 70.7, 175.6, 182.2, 48.7, 18.8, 6, 2.3], xAxisIndex: 0 }, { name: "蒸发量增量", type: "line", yAxisIndex: 1, data: [0, 2.9, 2.1, 16.2, 2.4, 51.1, 58.9, 26.6, -129.6, -12.6, -13.6, -3.1], xAxisIndex: 1 }, { name: "降水量增量", type: "line", yAxisIndex: 1, data: [0, 3.3, 3.1, 17.4, 2.3, 42, 104.9, 6.6, -133.5, -29.9, -12.8, -3.7], xAxisIndex: 1 } ] } ``` ### But when I copy the option-code to Echarts demo, I found that xAxis-name overlap with yAxis-label. 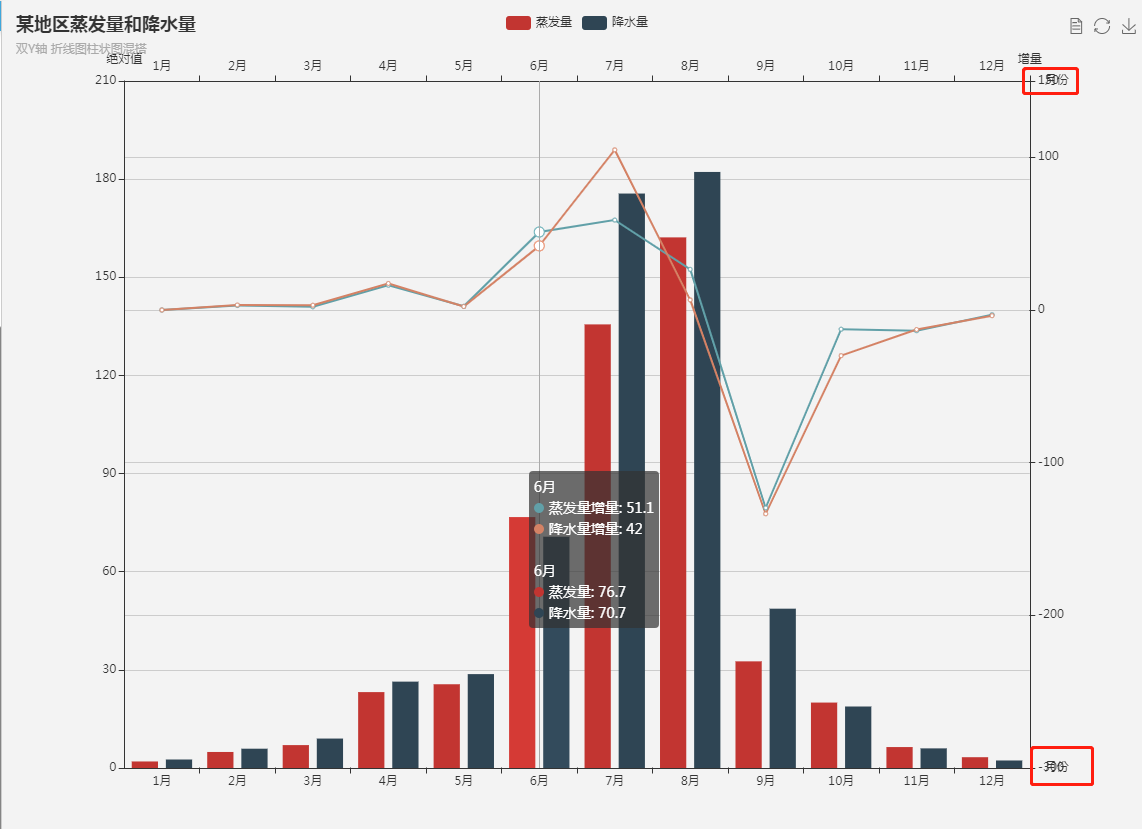 ### So I want to use `yAxis[i].axisLabel.rich.<user defined style name>.verticalAlign` and `formatter` to imitate. ``` yAxis: [ { type: "value", name: "绝对值" }, { type: "value", name: "增量", min: -300, max: 150, axisLabel: { formatter: function(value, index) { if (index === 0) {return `{bottom|${value}}`; } return `{top|${value}}`; }, rich: { top: { verticalAlign: 'top'}, bottom: { verticalAlign: 'bottom'}, } } } ], ``` But `yAxis[i].axisLabel.rich.<user defined style name>.verticalAlign`, not effect. I doubt that is my wrong in `formatter` function. Then I created an example. https://gallery.echartsjs.com/editor.html?c=xSLFCY0sd2&comment=0 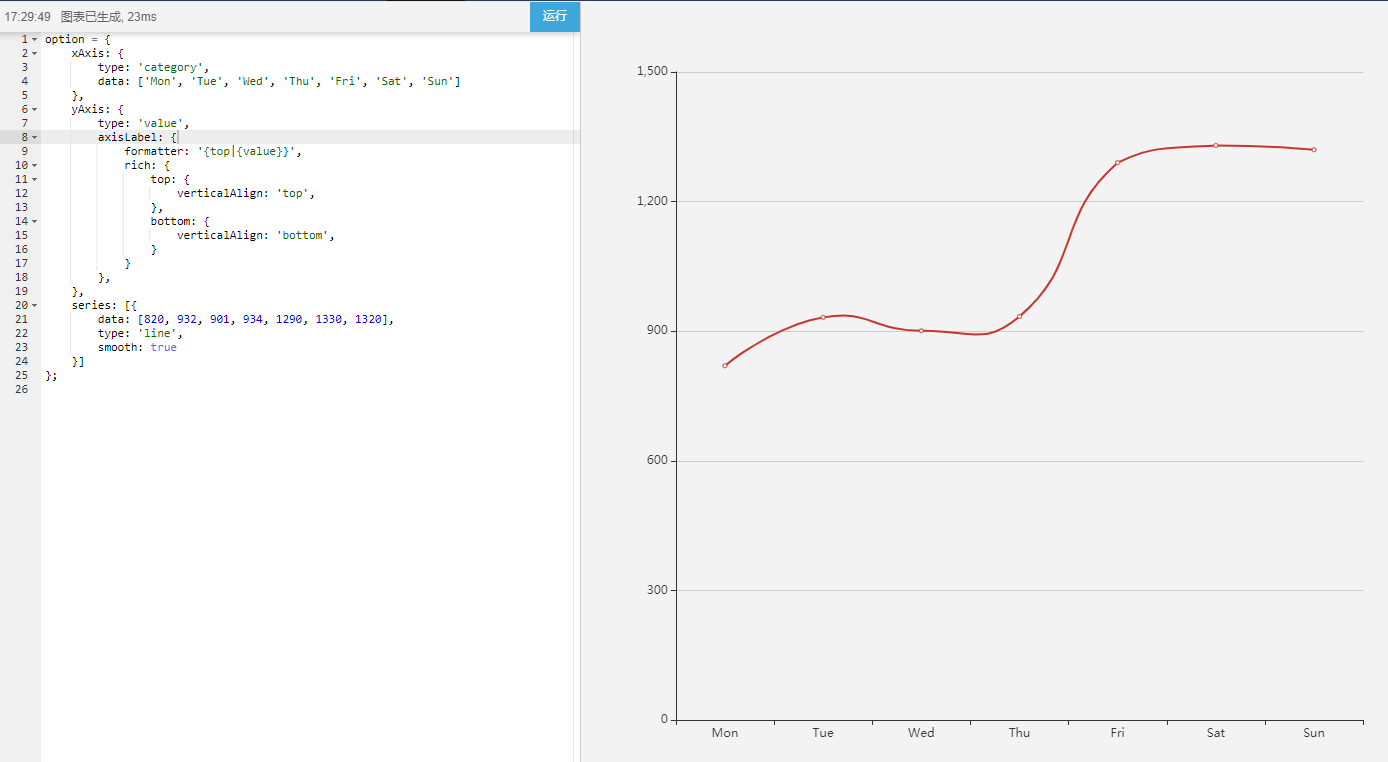 I found that `yAxis[i].axisLabel.rich.<user defined style name>.verticalAlign` still not effect.
----------------------------------------------------------------
This is an automated message from the Apache Git Service.
To respond to the message, please log on GitHub and use the
URL above to go to the specific comment.

For queries about this service, please contact Infrastructure at:
[email protected]


With regards,
Apache Git Services

---------------------------------------------------------------------
To unsubscribe, e-mail: [email protected]
For additional commands, e-mail: [email protected]