MINDoSOFT opened a new issue #10151: When setOption has dataZoom startValue or endValue, the label of the dataZoom slider does not show URL: https://github.com/apache/incubator-echarts/issues/10151 ### Version 4.2.1 ### Reproduction link [https://jsfiddle.net/gzvb2h4y/2/](https://jsfiddle.net/gzvb2h4y/2/) ### Steps to reproduce Open the provided jsfiddle and click the button which sets the start and end value of the dataZoom. Try to move the slider of the dataZoom (either start or end) and notice that no label is shown. 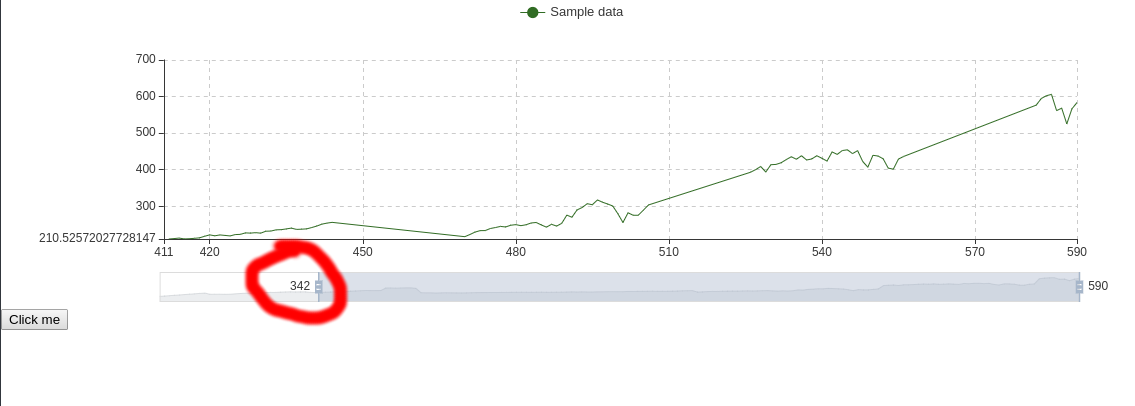 ### What is expected? I am expecting to see the dataZoom slider label even after setting the dataZoom options of the chart. ### What is actually happening? The dataZoom label is not shown after setting the chart options with dataZoom startValue or endValue is set. Clicking the zoom slider again this issue is resolved. --- I came across this bug because we need to dynamically adjust the dataZoom of the chart from an ajax call, and it happens every time in our scenario because we need to set the dataZoom startValue and endValue every time we do the ajax call. <!-- This issue is generated by echarts-issue-helper. DO NOT REMOVE --> <!-- This issue is in English. DO NOT REMOVE -->
----------------------------------------------------------------
This is an automated message from the Apache Git Service.
To respond to the message, please log on to GitHub and use the
URL above to go to the specific comment.

For queries about this service, please contact Infrastructure at:
[email protected]


With regards,
Apache Git Services

---------------------------------------------------------------------
To unsubscribe, e-mail: [email protected]
For additional commands, e-mail: [email protected]