laurapizza opened a new issue #10769: When adding units to the x Axis labels, the split area in the heatmap chart does not function correctly URL: https://github.com/apache/incubator-echarts/issues/10769 ### Version 4.2.1 ### Steps to reproduce **Context:** I want to use time intervals in my x axis. Passing an array of xAxisLabels to the `xAxis` object, with a `p` for denoting `pm` like so: `['1p', '2p', '3p']` ### What is expected? If I pass an array of just numbers: `['1','2','3']` It looks fine: 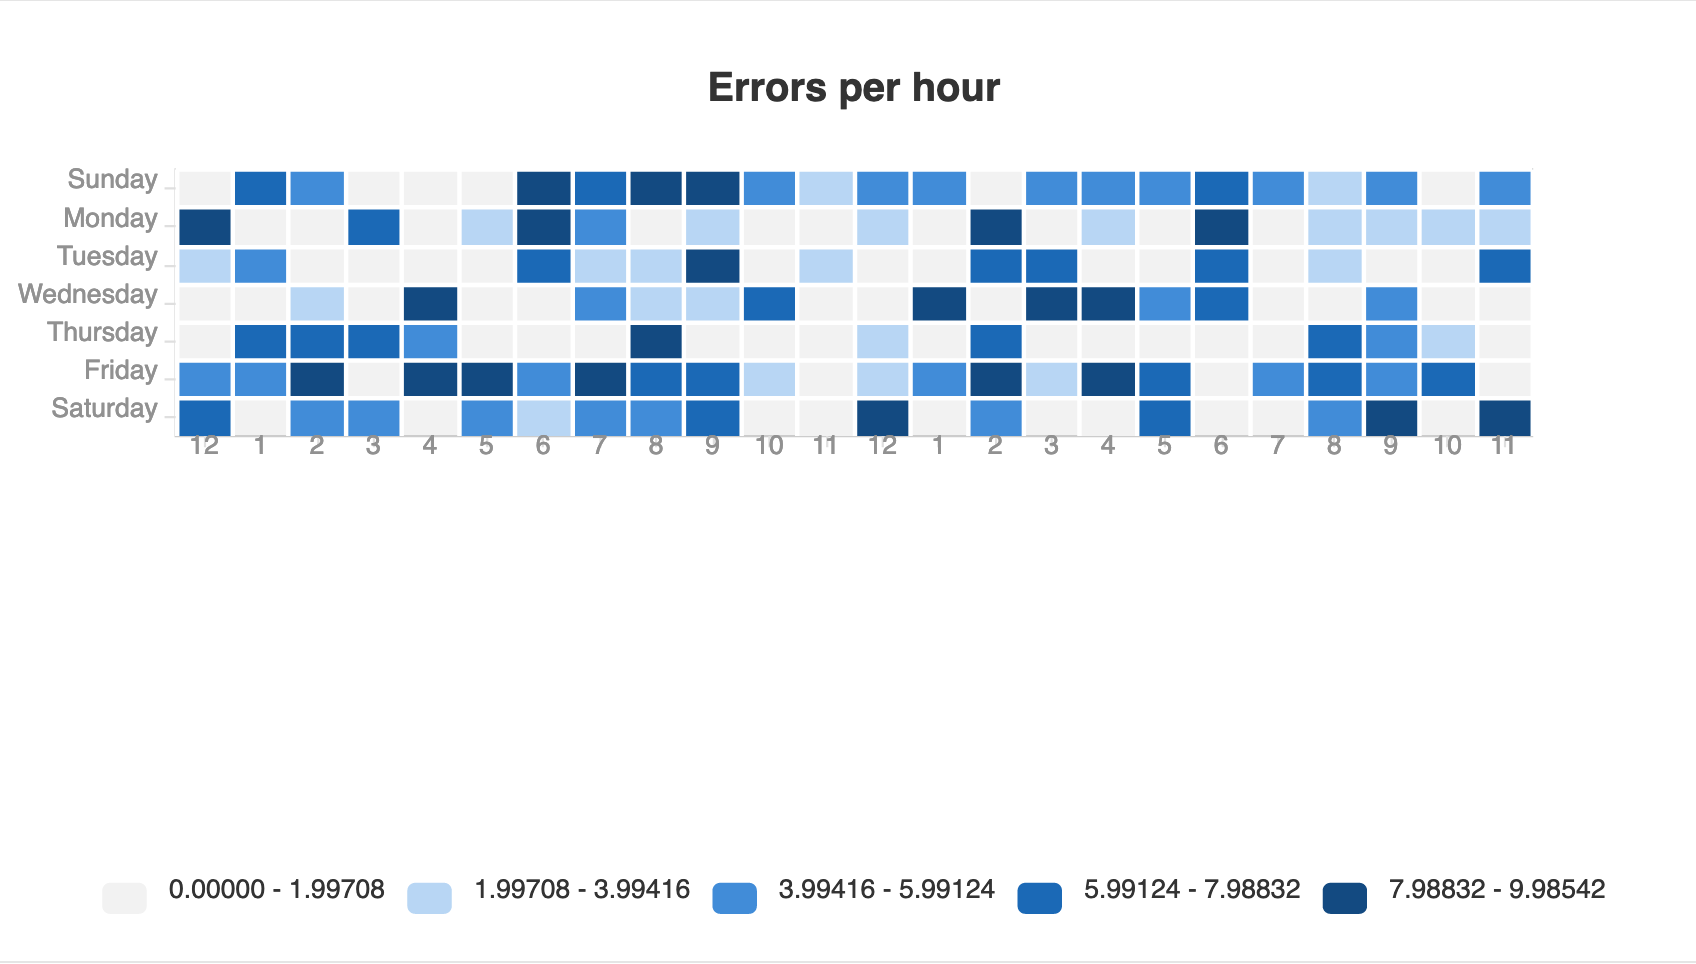 ### What is actually happening? The split area styles do not seem to function correctly: 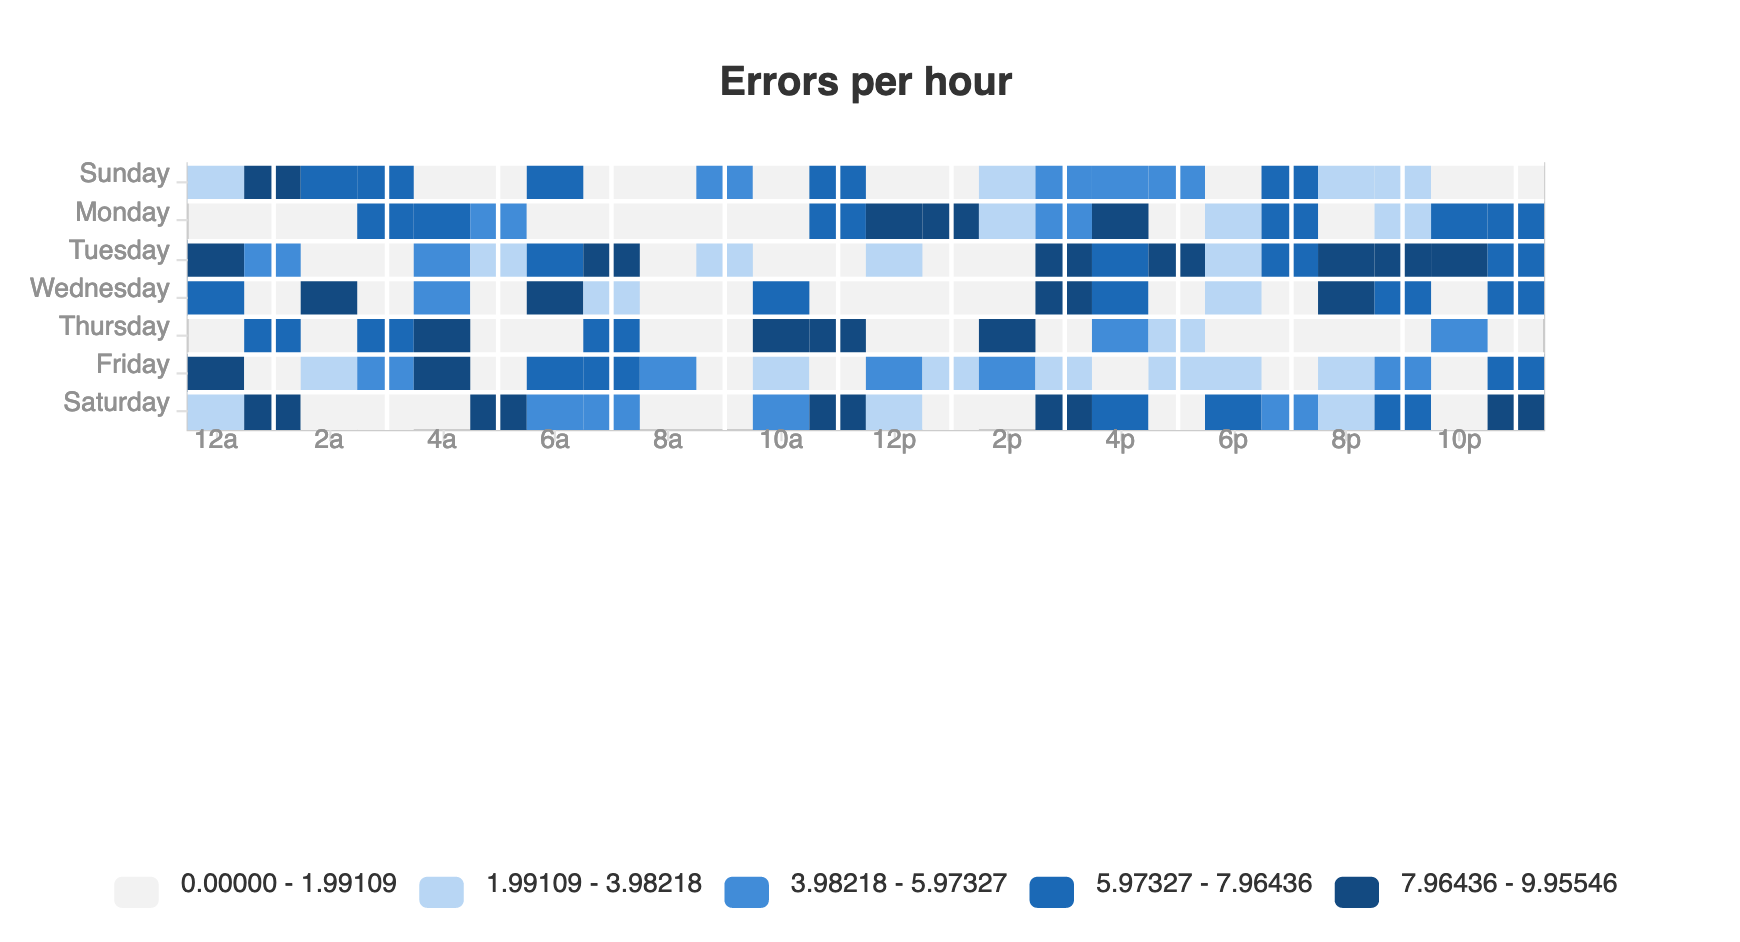 --- I am not sure if this is a bug or the intended behavior. @Ovilia <!-- This issue is generated by echarts-issue-helper. DO NOT REMOVE --> <!-- This issue is in English. DO NOT REMOVE -->
----------------------------------------------------------------
This is an automated message from the Apache Git Service.
To respond to the message, please log on to GitHub and use the
URL above to go to the specific comment.

For queries about this service, please contact Infrastructure at:
[email protected]


With regards,
Apache Git Services

---------------------------------------------------------------------
To unsubscribe, e-mail: [email protected]
For additional commands, e-mail: [email protected]