MINDoSOFT opened a new issue #10950: Custom axis ticks min URL: https://github.com/apache/incubator-echarts/issues/10950 ### What problem does this feature solve? We want to start rendering the axis ticks (and axis lines) after a specific value. This is useful because we render charts with custom x axis that is formatted as month year (MMM YYYY) format and we would like to show the axis ticks/lines only on the start of the year e.g. Jan 2018. e.g. In our dataset an x value of 434 represents Feb 2006, 435 represents Mar 2006 and so on and so forth. ### What does the proposed API look like? A new field should be added as xAxis.minAxisTick which will be the minimum value where the axis ticks/lines will start rendering in the grid. This option shouldn't affect the axis tick on the start of the axis. 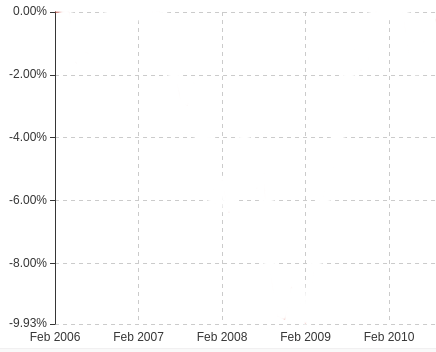 e.g. in the screenshot you can see the labels are on the following positions Feb 2006, Feb 2007, Feb 2008, Feb 2009, Feb 2010. and the desired labels should be as follows : Feb 2006, Jan 2007, Jan 2008, Jan 2009, Jan 2010. This should be achieved by setting xAxis.minAxisTick to e.g. 445 which represents the value for Jan 2007. Or to 11, to indicate how many axis ticks/lines to skip, before starting drawing them. <!-- This issue is generated by echarts-issue-helper. DO NOT REMOVE --> <!-- This issue is in English. DO NOT REMOVE -->
----------------------------------------------------------------
This is an automated message from the Apache Git Service.
To respond to the message, please log on to GitHub and use the
URL above to go to the specific comment.

For queries about this service, please contact Infrastructure at:
[email protected]


With regards,
Apache Git Services

---------------------------------------------------------------------
To unsubscribe, e-mail: [email protected]
For additional commands, e-mail: [email protected]