AgoniY opened a new issue #11076: echart gl中的scatter3D与bar3D在地图上的显示高度不一致问题 URL: https://github.com/apache/incubator-echarts/issues/11076 ### Version 4.2.1 ### Steps to reproduce 1.柱状图的最小值在地图上没有高度 2.当地图上不存在柱状图的时候,气泡消失 后来发现是跑到地图下面去了,官方社区的实例中发现了这个问题 与下图所示类似: 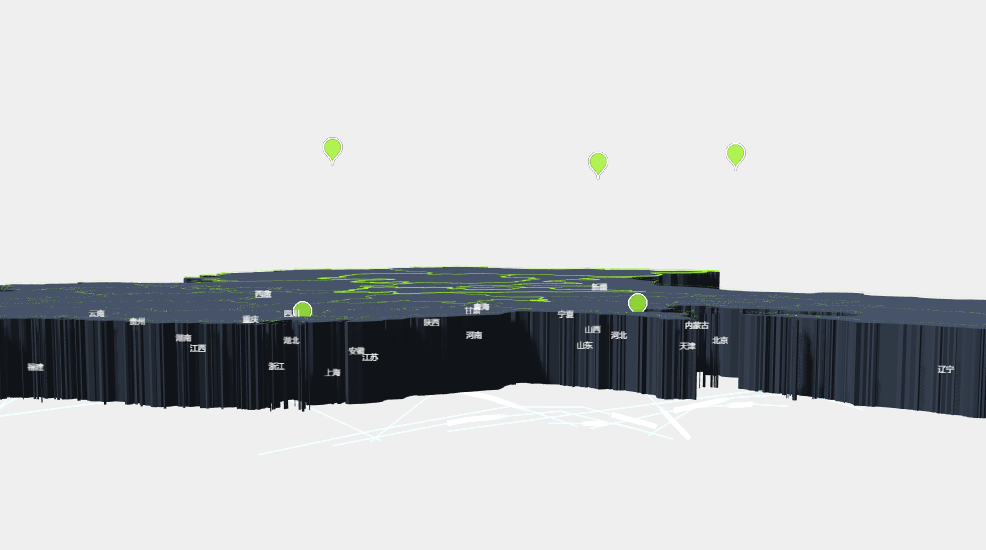 ### What is expected? 图形的高度以地图平面为起点来显示,起点value为0 ### What is actually happening? 图形的最小值在地图上显示没有高度 <!-- This issue is generated by echarts-issue-helper. DO NOT REMOVE -->
----------------------------------------------------------------
This is an automated message from the Apache Git Service.
To respond to the message, please log on to GitHub and use the
URL above to go to the specific comment.

For queries about this service, please contact Infrastructure at:
[email protected]


With regards,
Apache Git Services

---------------------------------------------------------------------
To unsubscribe, e-mail: [email protected]
For additional commands, e-mail: [email protected]