saLeox opened a new issue #1656:
URL: https://github.com/apache/incubator-linkis/issues/1656
### Search before asking - [X] I had searched in the [issues](https://github.com/apache/incubator-linkis/issues) and found no similar feature requirement. ### Problem Description Provide a solution for Linkis to monitor all running services. ### Description Linkis is a set of Microservices, and can be deployed in various mode: standalone, distribution, or Kubernetes. There should be a robust and flexible monitor mechanism to cover different cases. There are normally two options: Zabbix and Prometheus. For Zabbix, there is a restriction that one host can only bind with one JMX instance, and need to preset the JMX port for each application in addition. To avoid this issue, it's an option to use jstat command to fetch the JVM information from each instances, but the script is not standard and need to be placed in each server or docker. Prometheus is another option, and it has stronger capacity of pulling metrics from target. In the context of microservice, it provides the service discovery function, enabling to find targets dynamically from service register center, like Eureka, Consul, etc, and pull the metrics from API endpoint over http protocol. This feature will focus on enabling either long-running service or ac-hoc service, like engine conn, to expose the standard endpoint for prometheus, after which prometheus can fetch the service instances from eureka and connect to those endpoint to get metrics. Live examples might be helpful as well, specially for the alter or the visualization in the later stages, after and we will figure out how to make it works. ### Use case 1. Make all microservice expose metrics endpoints; 2. Make all instances can be found by prometheus; 3. Running prometheus and set linkis as available targets; 4. Define proper alert rule to monitor Linkis; 5. Provide an example to display the metrics in grafana; 6. Test in different scenarios: standalone, distribution, and Kubernetes. ### solutions 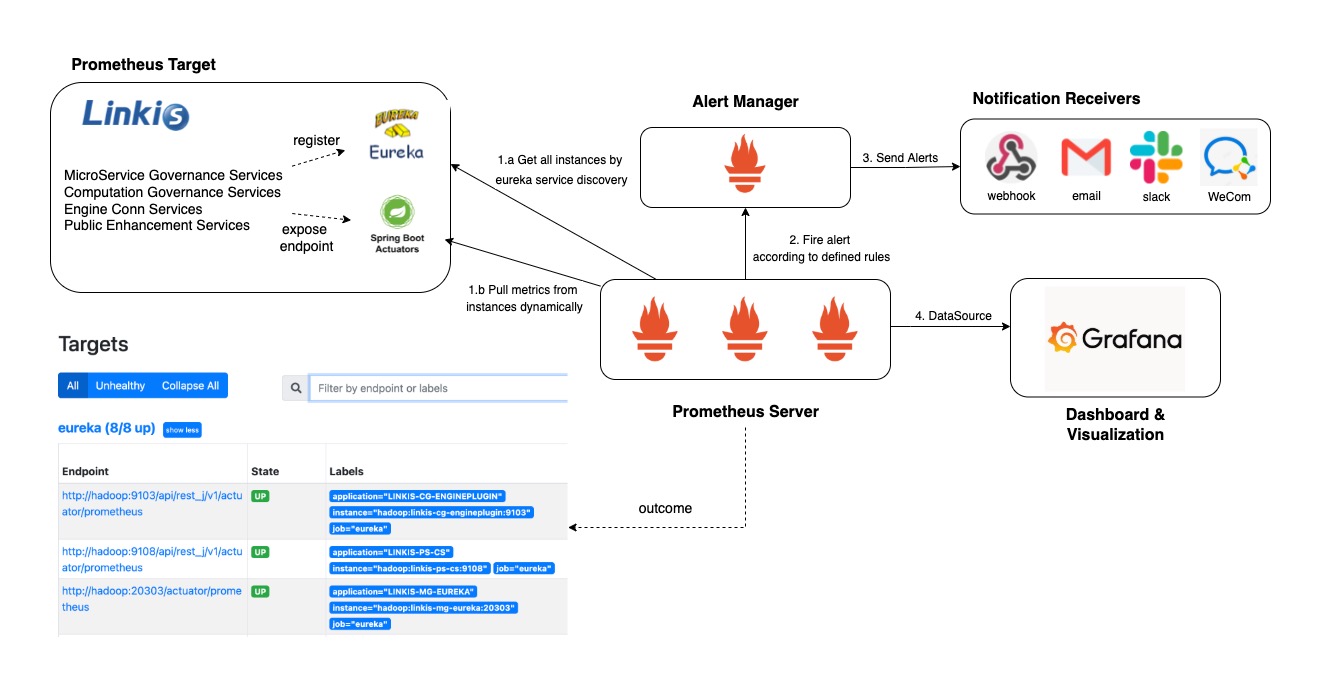 Enable all services to ### Anything else _No response_ ### Are you willing to submit a PR? - [X] Yes I am willing to submit a PR! -- This is an automated message from the Apache Git Service. To respond to the message, please log on to GitHub and use the URL above to go to the specific comment. To unsubscribe, e-mail: [email protected] For queries about this service, please contact Infrastructure at: [email protected] --------------------------------------------------------------------- To unsubscribe, e-mail: [email protected] For additional commands, e-mail: [email protected]