Ooooooog opened a new issue #4257: Line Chart lines are not continuos URL: https://github.com/apache/incubator-superset/issues/4257 Make sure these boxes are checked before submitting your issue - thank you! - [v] I have checked the superset logs for python stacktraces and included it here as text if any - [v] I have reproduced the issue with at least the latest released version of superset - [v] I have checked the issue tracker for the same issue and I haven't found one similar I'm trying to draw 'Time Series - Line Chart' with by data with time granurality 5 minutes. I'm using metrics 'count'. I'm seeing these wierd cut lines whenever the value goes to 0, or jumps from 0. Is this a bug or am I missing something? ### Superset version 0.22.1 ### Expected results lines should be connected to 0 values ### Actual results 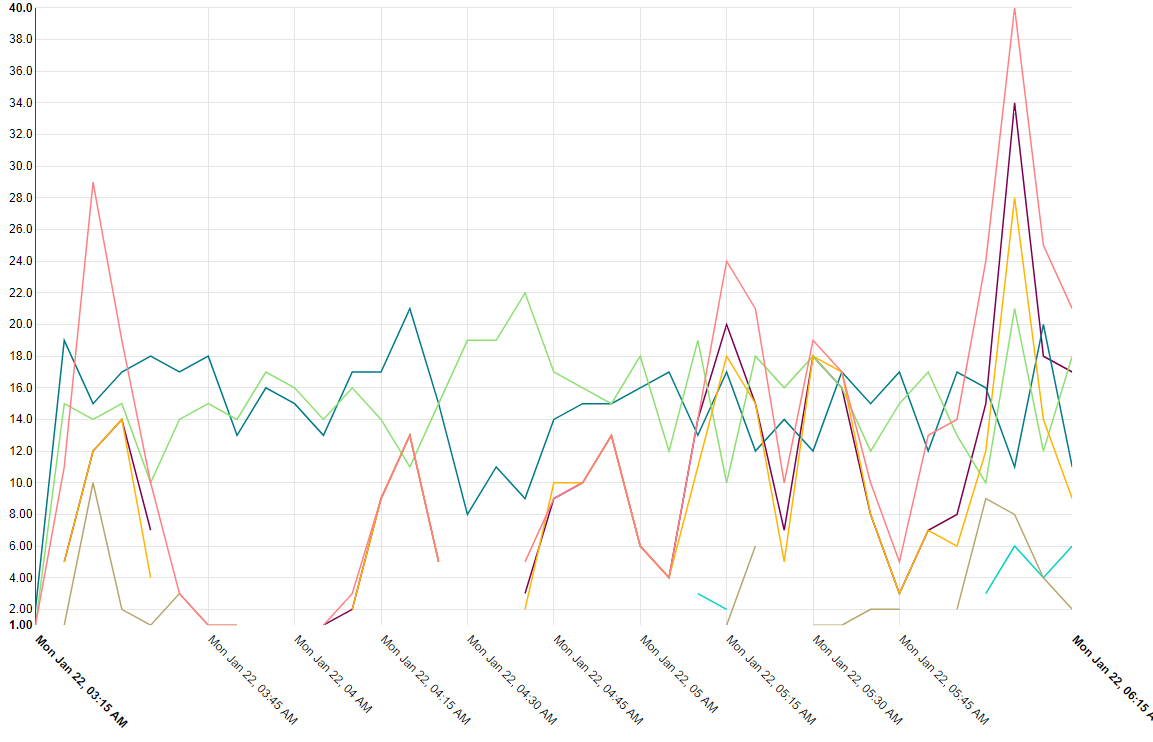 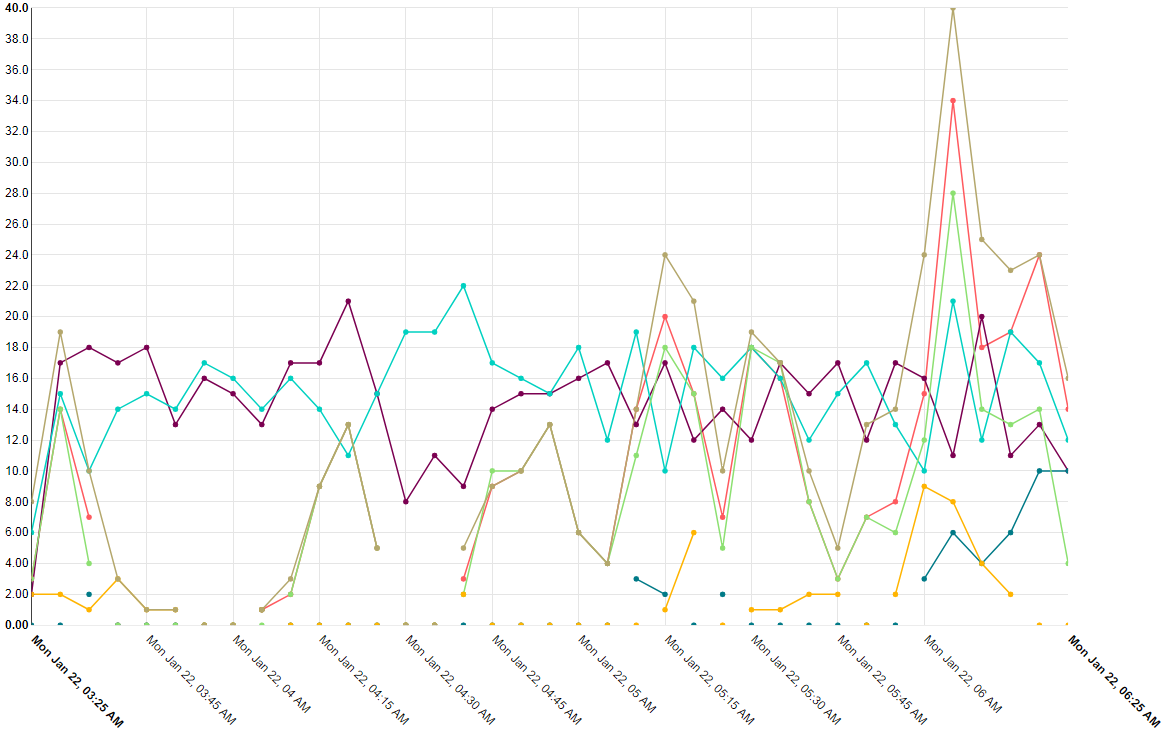 ### Steps to reproduce It doesn't happen if all the data value is higher than 1.
----------------------------------------------------------------
This is an automated message from the Apache Git Service.
To respond to the message, please log on GitHub and use the
URL above to go to the specific comment.

For queries about this service, please contact Infrastructure at:
[email protected]


With regards,
Apache Git Services