rumbin opened a new issue #3142: [dashboard, time-series bar chart] scrollbars always visible, regardless of slice dimensions URL: https://github.com/apache/incubator-superset/issues/3142 Make sure these boxes are checked before submitting your issue - thank you! - [x] I have checked the superset logs for python stacktraces and included it here as text if any - [x] I have reproduced the issue with at least the latest released version of superset - [x] I have checked the issue tracker for the same issue and I haven't found one similar ### Superset version superset 0.18.5, but the issue exists at least since 0.18.2. ### Expected results By defining a slice area large enough to accommodate the entire plot, the scroll bars dissappear. This worked in superset 0.15.4. ### Actual results Regardness how large the slice dimensions are chosen, there are always scrollbars shown, when a _Time-series bar chart_ is included into a dashboard. The _Bottom margin_ parameter doesn't seem to influence this behavior. 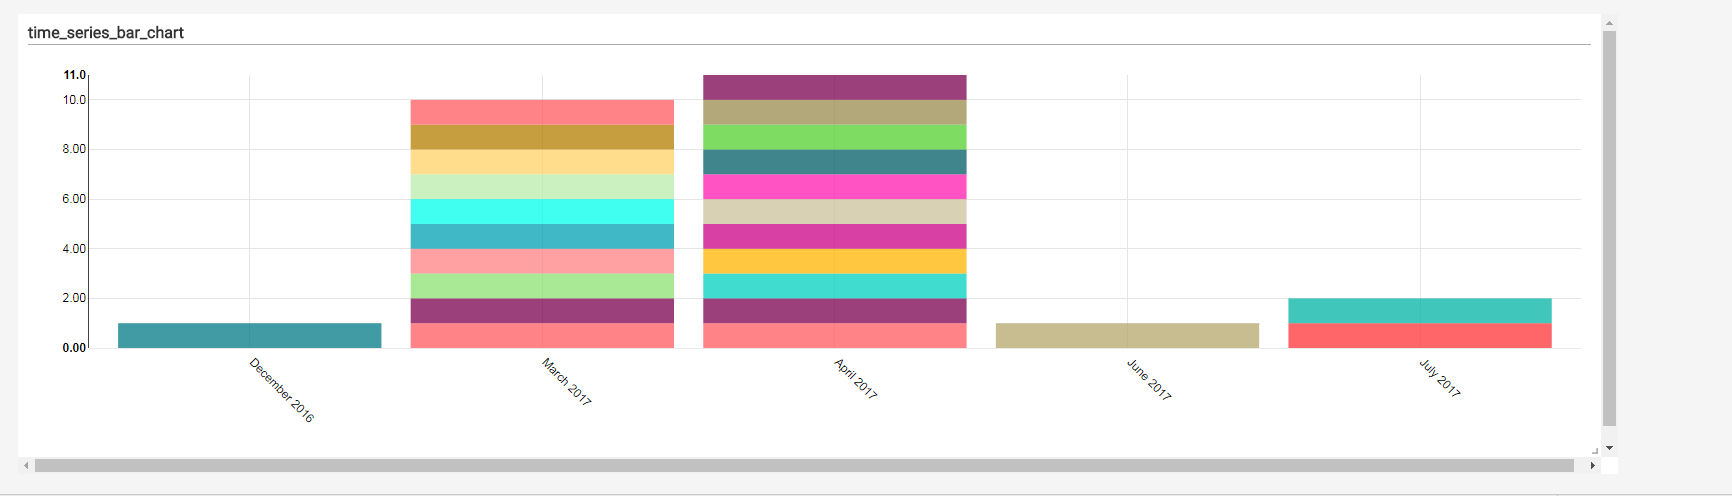 ### Steps to reproduce Create a _Time-series bar chart_ slice and add it to a dashboard. Then try to resize it until the scrollbars are gone. This is futile...
----------------------------------------------------------------
This is an automated message from the Apache Git Service.
To respond to the message, please log on GitHub and use the
URL above to go to the specific comment.

For queries about this service, please contact Infrastructure at:
[email protected]


With regards,
Apache Git Services