Github user Leemoonsoo commented on the pull request:
https://github.com/apache/incubator-zeppelin/pull/27#issuecomment-90808886
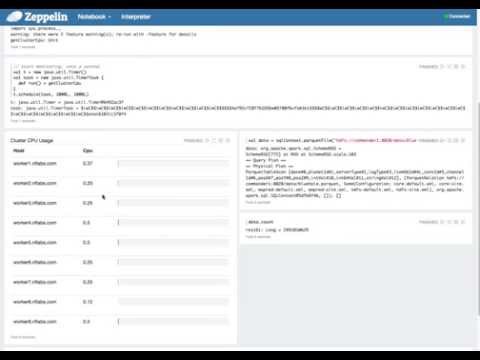
Here's another fun example, that monitors spark worker's cpu and display
them on Zeppelin, in realtime.
[](http://www.youtube.com/watch?v=cWuWUvWVLx4)
The code is not perfect. but you'll see the idea and capabilities of this
Angular display system.
Here's scala part
```scala
import sys.process._
// get cluster cpu info using spark
def getClusterCpu = {
sc.setLocalProperty("spark.scheduler.pool", "fair");
val clusterCpu = sc.parallelize(1 to 10).map{s=>
(("hostname" !!).replace("\n", ""), "mpstat 1 1" !!)
}.map{ s =>
(s._1, ((100.0 -
s._2.split("\n")(3).split("\\s+")(10).toDouble)*100).toInt.toDouble / 100)
}.reduceByKey((a,b) => scala.math.max(a,b)).collect.sortWith(_._1 <
_._1)
z.angularBind("cpuUsage", clusterCpu)
}
// start monitoring. once a second.
val t = new java.util.Timer()
val task = new java.util.TimerTask {
def run() = getClusterCpu
}
t.schedule(task, 1000L, 1000L)
```
here's angular part
```html
%angular
Cluster CPU Usage
<table class="table">
<tr>
<th style="width:200px">Host</th>
<th style="width:100px">Cpu</th>
<th></th>
</tr>
<tr ng-repeat="info in cpuUsage">
<td>{{info._1}}</td>
<td>{{info._2}}</td>
<td>
<div class="progress">
<div class="progress-bar" role="progressbar"
aria-valuenow="{{info._2}}" aria-valuemin="0" aria-valuemax="100" style="width:
{{info._2}}%;">
<span class="sr-only">{{info._2}}%</span>
</div>
</div>
</td>
</tr>
</table>
```
---
If your project is set up for it, you can reply to this email and have your
reply appear on GitHub as well. If your project does not have this feature
enabled and wishes so, or if the feature is enabled but not working, please
contact infrastructure at [email protected] or file a JIRA ticket
with INFRA.
---