Quoting "Eric S. Raymond" <e...@thyrsus.com>:
Dan Drown <dan-...@drown.org>:
>Eric: Please plug your 701W into your Pi with HAT and collect some data.
Here's 7 days worth of data:

https://dan.drown.org/rpi/usb-vs-gpio-pps.html

The Rapsberry Pi 2's GPIO-PPS based local clock offsets at 0.1 percentile
and 99.9 percentile were -3.61 microseconds and 4.13 microseconds.

The Raspberry Pi's USB-PPS based local clock offsets at 1 percentile and 99
percentile were -582.97 microseconds and 539.08 microseconds.
Dan and Hal, how do you interpret those results? I would naively suppose
that the listed fudge should be the mean of each distribution (assuming
it looks Gaussian) and thius the arithmetic average of those pars
- am I missing anything?
The fudge setting is a different thing altogether. This is more along
the lines of the level of precision available.
I'm using this as my fudge (I think I'm getting the trailing edge of a
100ms pulse):
fudge 127.127.22.1 refid PPSU time1 0.100700
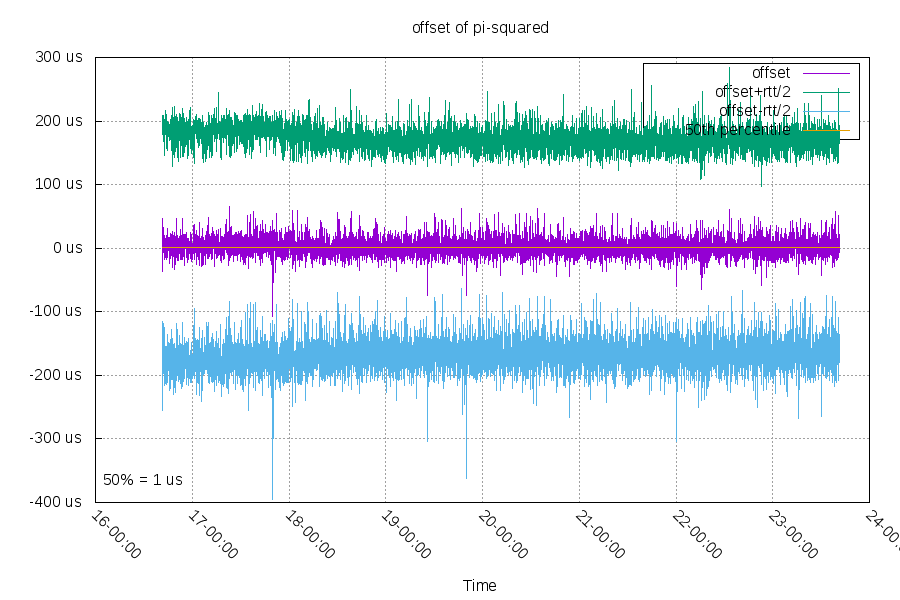
I use the 50 percentile offset of my nearby clocks to set the fudge factor.
One example graph between the Pi2 and a third machine to show the 50
percentile value:
https://dan.drown.org/rpi/remote-statistics.10.1.2.19.png
_______________________________________________
devel mailing list
devel@ntpsec.org
http://lists.ntpsec.org/mailman/listinfo/devel