<!--
为了方便我们能够复现和修复 bug,请遵从下面的规范描述您的问题。
-->
### One-line summary [问题简述] 使用line3D绘制流向图,绘制出来的线是不平滑的折线,不知道有什么办法可以更改线的平滑程度。 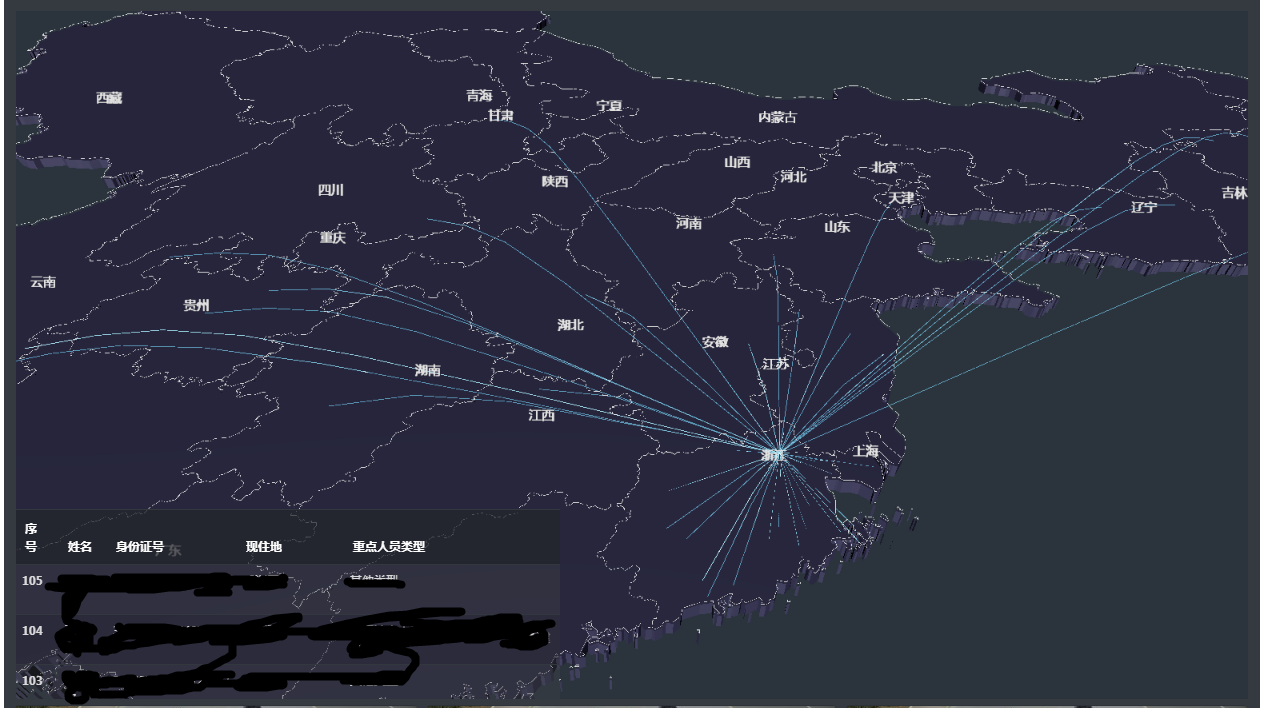 ### Version & Environment [版本及环境] + ECharts version [ECharts 版本]: ECharts 4.1.0 + Browser version [浏览器类型和版本]: Chrome 68.0.3440.84 + OS Version [操作系统类型和版本]: WIN7 SP1 ### Expected behaviour [期望结果] 希望绘制出来的线可以是圆滑的曲线。 ### ECharts option [ECharts配置项] <!-- Copy and paste your 'echarts option' here. --> <!-- [下方贴你的option,注意不要删掉下方 ```javascript 和 尾部的 ``` 字样。最好是我们能够直接运行的 option。如何得到能运行的 option 参见上方的 guidelines for contributing] --> ```javascript option = { geo3D: { map: 'china', shading: 'realistic', silent: true, environment: '#343a40', realisticMaterial: { roughness: 0.8, metalness: 0 }, postEffect: { enable: true }, groundPlane: { show: false }, light: { main: { intensity: 1, alpha: 30 }, ambient: { intensity: 0 } }, viewControl: { //distance: 70, alpha: 40, distance:30, beta:40, center:[15,-5,10], minDistance:10, panMouseButton: 'left', rotateMouseButton: 'right' }, itemStyle: { color: '#444359', borderWidth:0.5, borderColor:'#d9d9d9' }, label: { show: true, textStyle: { color: '#fff', //地图初始化区域字体颜色 fontFamily:'微软雅黑', fontSize: 16, opacity: 1, backgroundColor: 'rgba(0,23,11,0)' }, }, emphasis: { //当鼠标放上去 地区区域是否显示名称 label: { show: true, textStyle: { color: '#fff', fontSize: 16, backgroundColor: 'rgba(0,23,11,0)' } } }, regionHeight: 0.5 }, series: [{ type: 'lines3D', coordinateSystem: 'geo3D', effect: { show: true, trailWidth: 1, trailOpacity: 0.5, trailLength: 0.2 }, blendMode: 'lighter', //lineStyle: { // color:'#61A5CA', // width: 0.2, // opacity: 0.05 //}, // blendMode: 'lighter', lineStyle: { color:'#61A5CA', width: 0.9, opacity: 0.5 }, data: [] }] }; } ``` ### Other comments [其他信息] <!-- For example: Screenshot or Online demo --> <!-- [例如,截图或线上实例 (JSFiddle/JSBin/Codepen)] --> 完整代码为: function formatData(){ var routes = []; for(var i=0;i<zdryFlightData.length;i++){ var posObj = bm2zbData[zdryFlightData[i]["xzdqh"]]; if(!posObj){ console.log(zdryFlightData[i]["xzdqh"]); continue; } var flightRoad = [[posObj['lon'],posObj['lat']],[120.049831,30.567583]]; routes.push(flightRoad); } return routes; } function drawZdryFlightChart(){ var option = myChart.getOption(); if(!option){ option = { geo3D: { map: 'china', shading: 'realistic', silent: true, environment: '#343a40', realisticMaterial: { roughness: 0.8, metalness: 0 }, postEffect: { enable: true }, groundPlane: { show: false }, light: { main: { intensity: 1, alpha: 30 }, ambient: { intensity: 0 } }, viewControl: { //distance: 70, alpha: 40, distance:30, beta:40, center:[15,-5,10], minDistance:10, panMouseButton: 'left', rotateMouseButton: 'right' }, itemStyle: { color: '#444359', borderWidth:0.5, borderColor:'#d9d9d9' }, label: { show: true, textStyle: { color: '#fff', //地图初始化区域字体颜色 fontFamily:'微软雅黑', fontSize: 16, opacity: 1, backgroundColor: 'rgba(0,23,11,0)' }, }, emphasis: { //当鼠标放上去 地区区域是否显示名称 label: { show: true, textStyle: { color: '#fff', fontSize: 16, backgroundColor: 'rgba(0,23,11,0)' } } }, regionHeight: 0.5 }, series: [{ type: 'lines3D', coordinateSystem: 'geo3D', effect: { show: true, trailWidth: 1, trailOpacity: 0.5, trailLength: 0.2 }, blendMode: 'lighter', //lineStyle: { // color:'#61A5CA', // width: 0.2, // opacity: 0.05 //}, // blendMode: 'lighter', lineStyle: { color:'#61A5CA', width: 0.9, opacity: 0.5 }, data: [] }] }; } option.series[0].data = formatData(); myChart.setOption(option,true); myChart.hideLoading(); } [ Full content available at: https://github.com/apache/incubator-echarts/issues/8925 ] This message was relayed via gitbox.apache.org for [email protected]