样例http://gallery.echartsjs.com/editor.html?c=xByOFPcjBe
95行增加
axisPointer: {
link: {xAxisIndex: [0,1,2]}
},
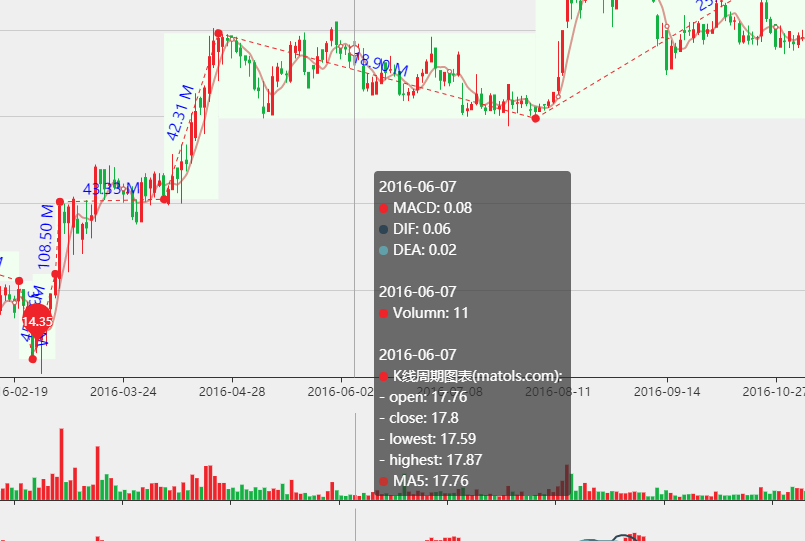
后 图的tooltip MACD 显示在了最上方
### Expected behaviour [期望结果]
实际应该是想第一张图的数据显示在最上方
### ECharts option [ECharts配置项]
tooltip: {
trigger: 'axis',
axisPointer: {
type: 'line'
}
},
axisPointer: {
link: {xAxisIndex: [0,1,2]}
},
legend: {
data: ['KLine', 'MA5']
},
[ Full content available at:
https://github.com/apache/incubator-echarts/issues/8926 ]
This message was relayed via gitbox.apache.org for [email protected]