<!--
为了方便我们能够复现和修复 bug,请遵从下面的规范描述您的问题。
-->
### One-line summary [问题简述]
在绘拆线图选择区域填充时,填充的样式不可控。
### Version & Environment [版本及环境]
+ ECharts version [ECharts 版本]:
4.1
+ Browser version [浏览器类型和版本]:
chrome 68
+ OS Version [操作系统类型和版本]:
win10 64bit
### Expected behaviour [期望结果]
希望基于Y轴填充。
### ECharts option [ECharts配置项]
<!-- Copy and paste your 'echarts option' here. -->
<!-- [下方贴你的option,注意不要删掉下方 ```javascript 和 尾部的 ``` 字样。最好是我们能够直接运行的
option。如何得到能运行的 option 参见上方的 guidelines for contributing] -->
```javascript
option = {
"dataZoom" : [
{
"end" : 5,
"minSpan" : 1,
"start" : 0,
"type" : "inside",
"yAxisIndex" : 0
},
{
"labelPrecision" : 1,
"type" : "slider",
"yAxisIndex" : 0
}
],
"grid" : {
"bottom" : 20,
"left" : 50,
"right" : 40,
"top" : 10
},
"series" : [
{
"areaStyle" : {
"origin" : "end"
},
"data" : [
[ 10, 0 ],
[ 32, 25 ],
[ 28, 50 ],
[ 29, 75 ],
[ 40, 100 ],
[ 27, 125 ],
[ 26, 150 ],
[ 36, 175 ],
[ 26, 200 ],
[ 27, 225 ],
[ 28, 250 ],
[ 36, 275 ],
[ 33, 300 ],
[ 36, 325 ],
[ 51, 350 ],
[ 48, 375 ],
[ 52, 400 ],
[ 49, 425 ],
[ 57, 450 ],
[ 49, 475 ],
[ 49, 500 ],
[ 43, 525 ],
[ 40, 550 ],
[ 58, 575 ],
[ 49, 600 ],
[ 53, 625 ],
[ 50, 650 ],
[ 42, 675 ],
[ 28, 700 ],
[ 42, 725 ],
[ 47, 750 ],
[ 60, 775 ],
[ 47, 800 ],
[ 59, 825 ],
[ 30, 850 ],
[ 51, 875 ],
[ 56, 900 ],
[ 70, 925 ],
[ 87, 950 ],
[ 31, 975 ],
[ 18, 1000 ],
[ 20, 1025 ],
[ 20, 1050 ],
[ 31, 1075 ],
[ 39, 1100 ],
[ 23, 1125 ],
[ 27, 1150 ],
[ 34, 1175 ],
[ 48, 1200 ],
[ 37, 1225 ],
[ 34, 1250 ],
[ 19, 1275 ],
[ 26, 1300 ],
[ 19, 1325 ],
[ 28, 1350 ],
[ 26, 1375 ],
[ 89, 1400 ]
],
"key" : "1d83ba2d_d81a_4b47_bec4_a26a3d71eb39",
"smooth" : true,
"type" : "line"
}
],
"xAxis" : {
"min" : 0,
"scale" : true,
"type" : "value"
},
"yAxis" : {
"inverse" : true
}
}
```
### Other comments [其他信息]
<!-- For example: Screenshot or Online demo -->
<!-- [例如,截图或线上实例 (JSFiddle/JSBin/Codepen)] -->
当前效果
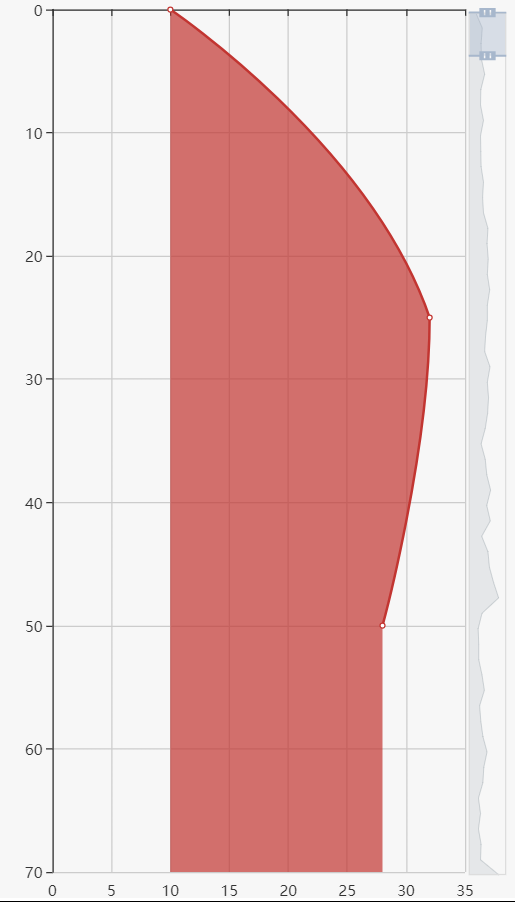
拖动数据后的效果

期望效果

[``[](url)]([url]([url](url)))
[ Full content available at:
https://github.com/apache/incubator-echarts/issues/8963 ]
This message was relayed via gitbox.apache.org for [email protected]