I want to modify the maximum and minimum values to represent, for this I use
the option of:
"series": min: 0 and max: 150.
I use a graphic of the gallery, the url is:
[http://gallery.echartsjs.com/editor.html?c=xryw3vNUll]
the option code is:
```
function detectionData(str) {
var color = '#5eb95e';
var Control = _ValorMax - _ValorMin;
if (str >= 30 && str <= 60) {
color = '#F37B1D';
} else if (str > 60) {
color = '#dd514c';
}
return color;
}
var option = {
title: {
"text": _Titulo,
"x": '50%',
"y": '0%',
"textAlign": "center",
"textStyle": {
"fontWeight": 'normal',
"fontSize": 16,
"color": "#000000",
},
},
"tooltip": {
"formatter": "{a} <br/>{b} : {c}%"
},
"series": [{
"name": "",
"type": "gauge",
center: ['50%', '56%'],
min: 0,
max: 150,
radius: '62%', // Diametro del dial
"splitNumber": 8,
"axisLine": {
"lineStyle": {
"color": [
[0.01, "#F37B1D"],
[1, "#e9ecf3"]
],
"width": 20 //Ancho del dial
}
},
"axisTick": {
"lineStyle": {
"color": "#3bb4f2",
"width": 3
},
"length": -8,//Longitud del palito del valor
"splitNumber": 1
},
"axisLabel": {
"distance": -60,// Distancia adonde pone los valores
"textStyle": {
"color": "#000"
}
},
"splitLine": {
"show": false
},
"itemStyle": {
"normal": {
"color": "#494f50"
}
},
"detail": {
"formatter": "{value}"+ _Unidad,
"offsetCenter": [0, "60%"],
"textStyle": {
"fontSize": 16,
"color": "#F37B1D"
}
},
"title": {
"offsetCenter": [0, "100%"]
},
"data": [{
"name": _NombreSerie,
"value": _Valor
}]
}]
}
var ChartGauge = echarts.init(document.getElementById(_NombreRep));
timeTicket = setInterval(function (){
var amplitud = _Valor.valor;
amplitud = amplitud * (Math.random().toFixed(2)-0)*4.5>>0; // lo roto a la
dercha >>0 para sacar los decimales
option.series[0].data[0].value = amplitud;
option.series[0].axisLine.lineStyle.color[0][0] = (amplitud) / 100;
option.series[0].axisLine.lineStyle.color[0][1] = detectionData(amplitud);
ChartGauge.setOption(option, true);
}, 2000)
```
The image obtained is:
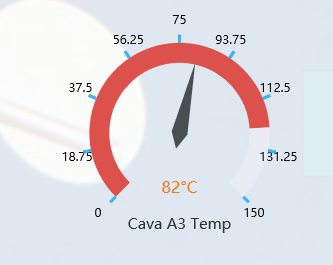
The problem that the filled area does not accompany the indicator dial, the
fault occurs if I change the min as the max. if I put them in min = 0 and max =
100 (default) it works correctly.
How could I fix this problem?
### Version & Environment [版本及环境]
+ ECharts version [ECharts 版本]: 4
+ Browser version [浏览器类型和版本]:All
+ OS Version [操作系统类型和版本]:Windows 10
[ Full content available at:
https://github.com/apache/incubator-echarts/issues/8972 ]
This message was relayed via gitbox.apache.org for [email protected]