<!--
为了方便我们能够复现和修复 bug,请遵从下面的规范描述您的问题。
-->
### One-line summary [问题简述]
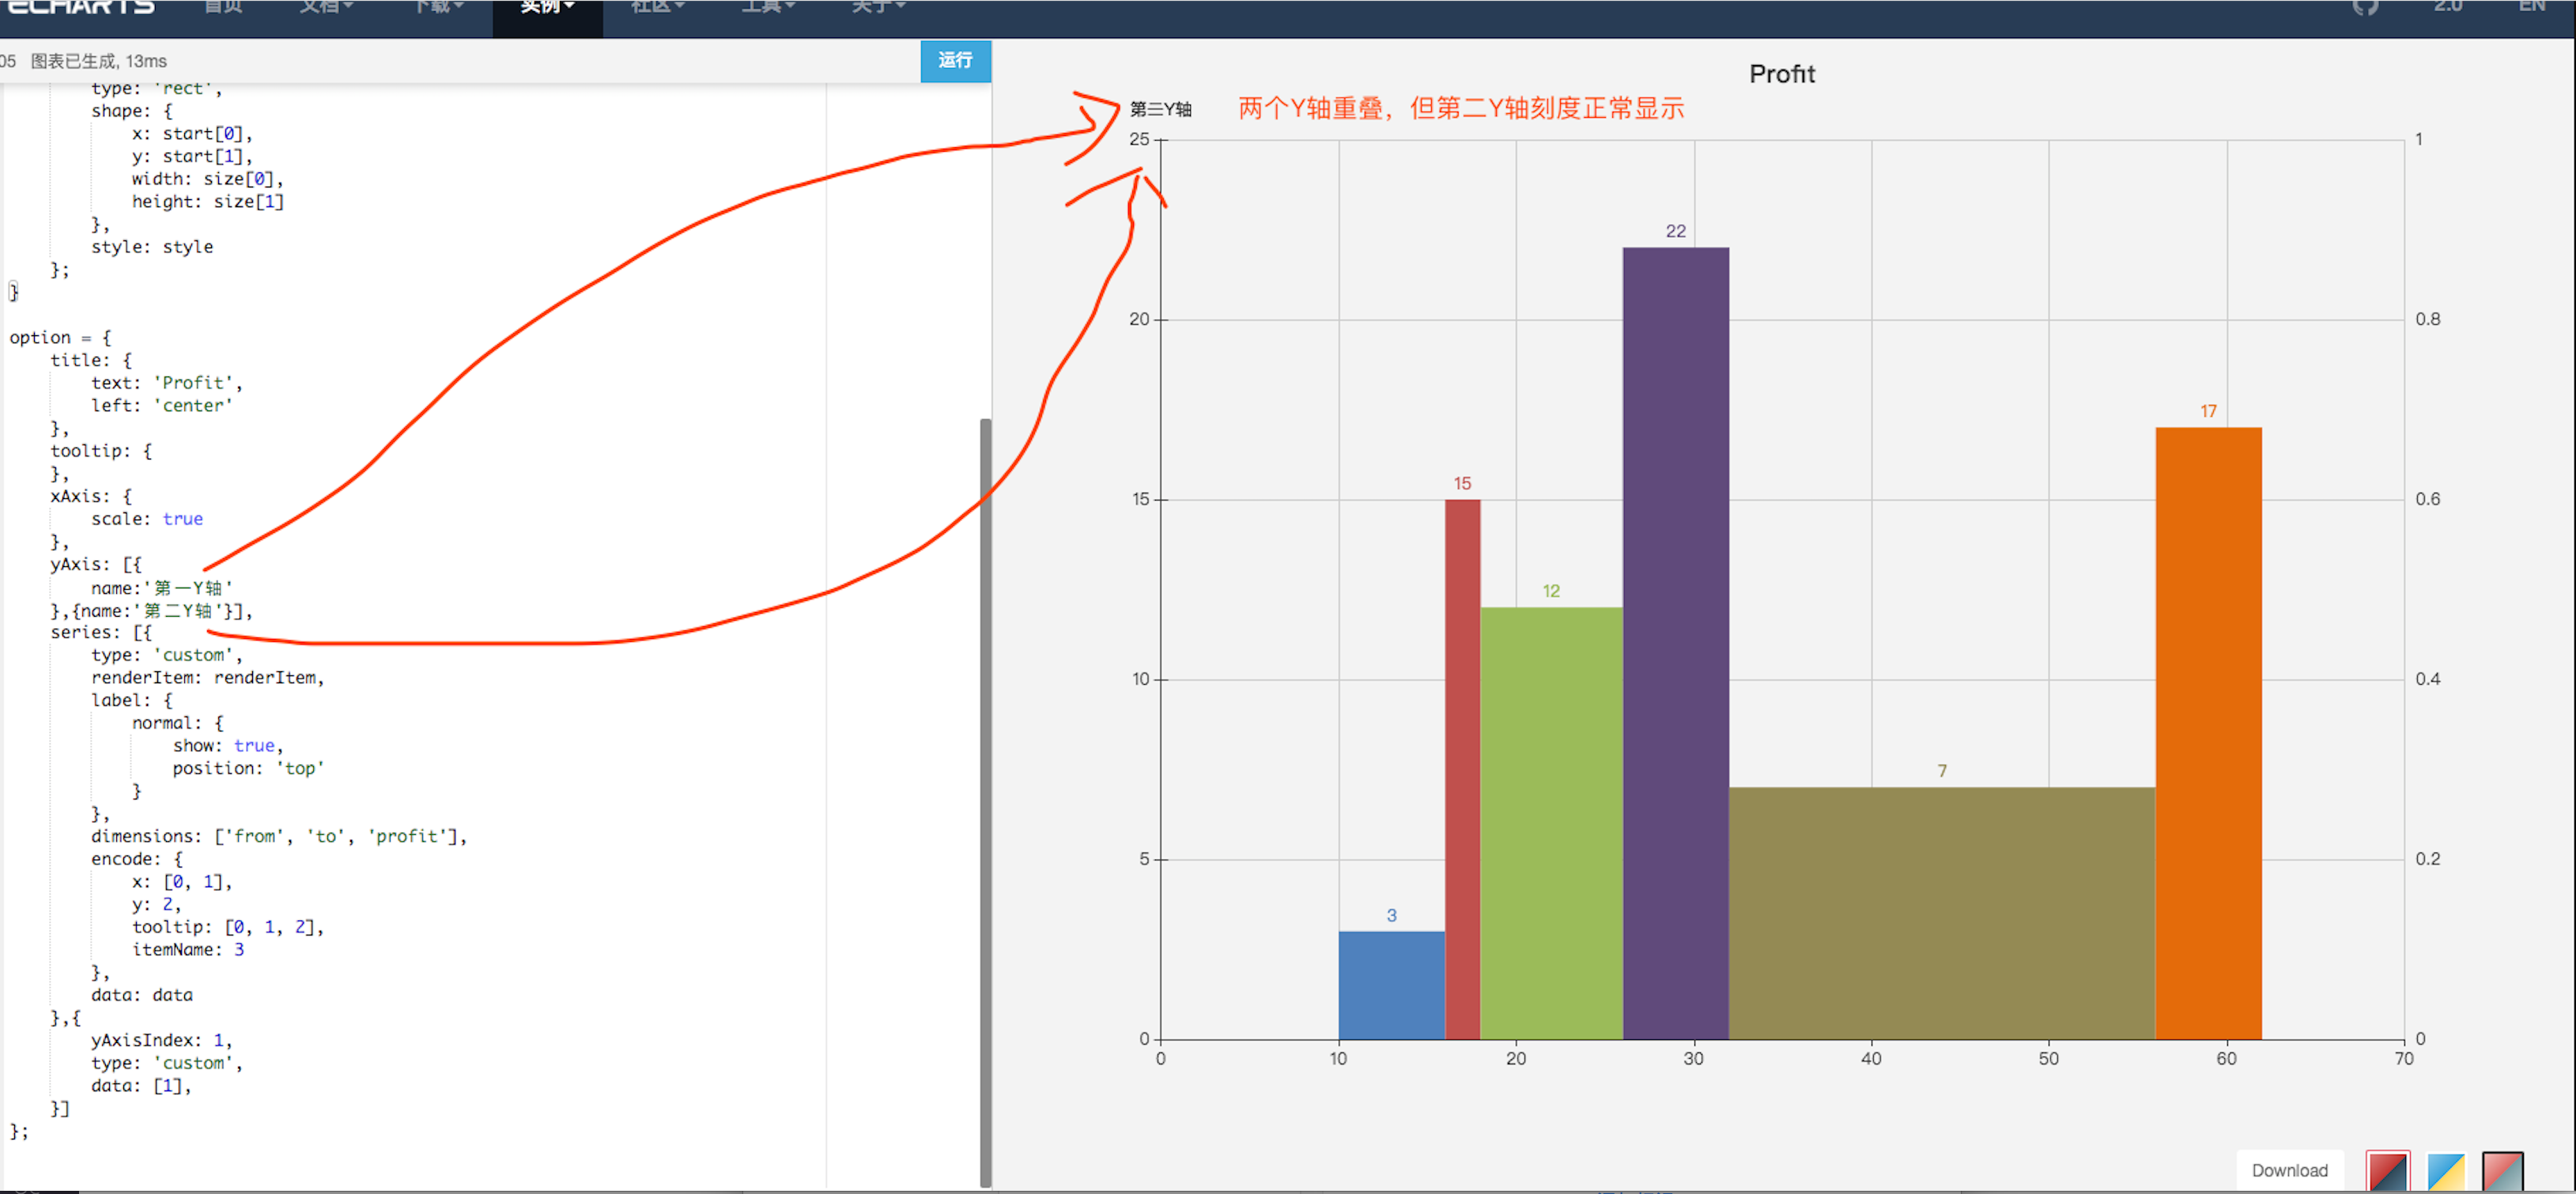
当使用 type 为 'custom' 类别的图形时,
使用了双Y轴,同时series下有两个custom系列存在的情况下 第两个Y轴会重叠,且无法设置位置
### Version & Environment [版本及环境]
+ ECharts version [ECharts 版本]: v 4.0
+ Browser version [浏览器类型和版本]: chrome
+ OS Version [操作系统类型和版本]: mac
### Expected behaviour [期望结果]
双Y轴一左一右显示
### ECharts option [ECharts配置项]
<!-- Copy and paste your 'echarts option' here. -->
<!-- [下方贴你的option,注意不要删掉下方 ```javascript 和 尾部的 ``` 字样。最好是我们能够直接运行的
option。如何得到能运行的 option 参见上方的 guidelines for contributing] -->
```javascript
var data = [[10, 16, 3, 'A'], [16, 18, 15, 'B'], [18, 26, 12, 'C'], [26, 32,
22, 'D'], [32, 56, 7, 'E'], [56, 62, 17, 'F']];
var colorList = ['#4f81bd', '#c0504d', '#9bbb59', '#604a7b', '#948a54',
'#e46c0b'];
data = echarts.util.map(data, function (item, index) {
return {
value: item,
itemStyle: {
normal: {
color: colorList[index]
}
}
};
});
function renderItem(params, api) {
var yValue = api.value(2);
var start = api.coord([api.value(0), yValue]);
var size = api.size([api.value(1) - api.value(0), yValue]);
var style = api.style();
return {
type: 'rect',
shape: {
x: start[0],
y: start[1],
width: size[0],
height: size[1]
},
style: style
};
}
option = {
title: {
text: 'Profit',
left: 'center'
},
tooltip: {
},
xAxis: {
scale: true
},
yAxis: [{
name:'第一Y轴'
},{name:'第二Y轴'}],
series: [{
type: 'custom',
renderItem: renderItem,
label: {
normal: {
show: true,
position: 'top'
}
},
dimensions: ['from', 'to', 'profit'],
encode: {
x: [0, 1],
y: 2,
tooltip: [0, 1, 2],
itemName: 3
},
data: data
},{
yAxisIndex: 1,
type: 'custom',
data: [1],
}]
};
```
### Other comments [其他信息]
<!-- For example: Screenshot or Online demo -->
<!-- [例如,截图或线上实例 (JSFiddle/JSBin/Codepen)] -->
[ Full content available at:
https://github.com/apache/incubator-echarts/issues/8975 ]
This message was relayed via gitbox.apache.org for [email protected]