<!--
为了方便我们能够复现和修复 bug,请遵从下面的规范描述您的问题。
-->
### One-line summary [问题简述] 1、选择单天日期 没有问题 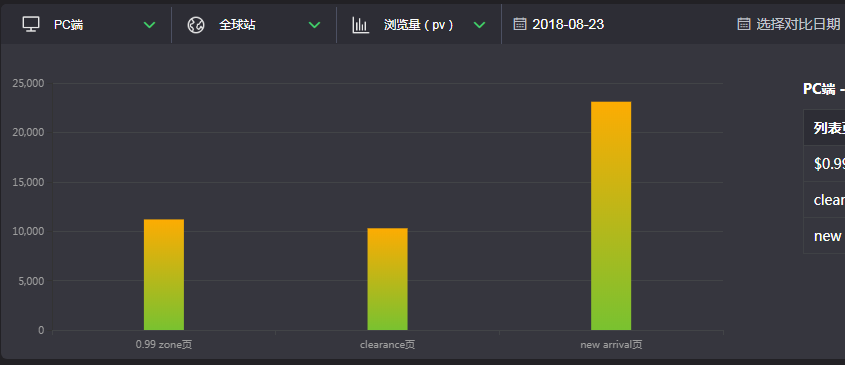 2、动态选择 对比日期 没有问题 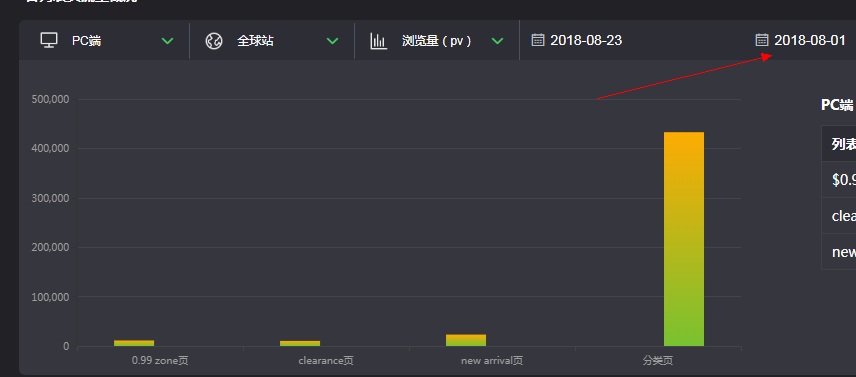 3、把对比日期给删除掉,并选择单天日期,对比日期的图形扔在  ### Version & Environment [版本及环境] + ECharts version [ECharts 版本]: 4.0.4 + Browser version [浏览器类型和版本]: chrome 68 + OS Version [操作系统类型和版本]: ### Expected behaviour [期望结果] ### ECharts option [ECharts配置项] <!-- Copy and paste your 'echarts option' here. --> <!-- [下方贴你的option,注意不要删掉下方 ```javascript 和 尾部的 ``` 字样。最好是我们能够直接运行的 option。如何得到能运行的 option 参见上方的 guidelines for contributing] --> ```javascript options.xAxis.axisLabel.showMinLabel = true options.xAxis.splitLine = { show: false } options.series = [] options.legend.data = [] options.legend.right = '60' options.xAxis.data = xList options.yAxis.min = 0 options.toolbox = { right: '30', itemSize: 14, top: '2.5%' } options.tooltip = { trigger: 'axis', axisPointer: { type: 'shadow', }, backgroundColor: 'rgba(40, 40, 48, 1)', padding: [10, 15], formatter: item => { let str = item[0].axisValueLabel + '<br/>' + colorSpan1 + time + ' / ' + item[0].seriesName + ' : ' + item[0].value + '<br/>' if (data2) { str += colorSpan2 + compareTime + ' / ' + item[0].seriesName + ' : ' + item[1].value } return str }, } options.grid.top = "8%" for (let i in model) { if (i !== 'timeList' && i !== 'timeDate') { options.series.push({ data: d1, type: 'bar', name: i, barMaxWidth: 40, itemStyle: { normal: { color: { colorStops: [ { offset: 0, color: "#FDAC02" }, { offset: 1, color: "#79C230" }, ], global: false, type: "linear", x: 0, x2: 0, y: 0, y2: 1, }, }, }, }) } } if (data2) { for (let i in data2) { if (i !== 'timeList' && i !== 'timeDate') { options.series.push({ data: d3, type: 'bar', name: i, barMaxWidth: 40, itemStyle: { normal: { color: { colorStops: [ { offset: 0, color: "#FDAC02" }, { offset: 1, color: "#79C230" }, ], global: false, type: "linear", x: 0, x2: 0, y: 0, y2: 1, }, }, }, }) } } } ``` ### Other comments [其他信息] <!-- For example: Screenshot or Online demo --> <!-- [例如,截图或线上实例 (JSFiddle/JSBin/Codepen)] --> [ Full content available at: https://github.com/apache/incubator-echarts/issues/9008 ] This message was relayed via gitbox.apache.org for [email protected]