<!--
为了方便我们能够复现和修复 bug,请遵从下面的规范描述您的问题。
-->
### One-line summary [问题简述]
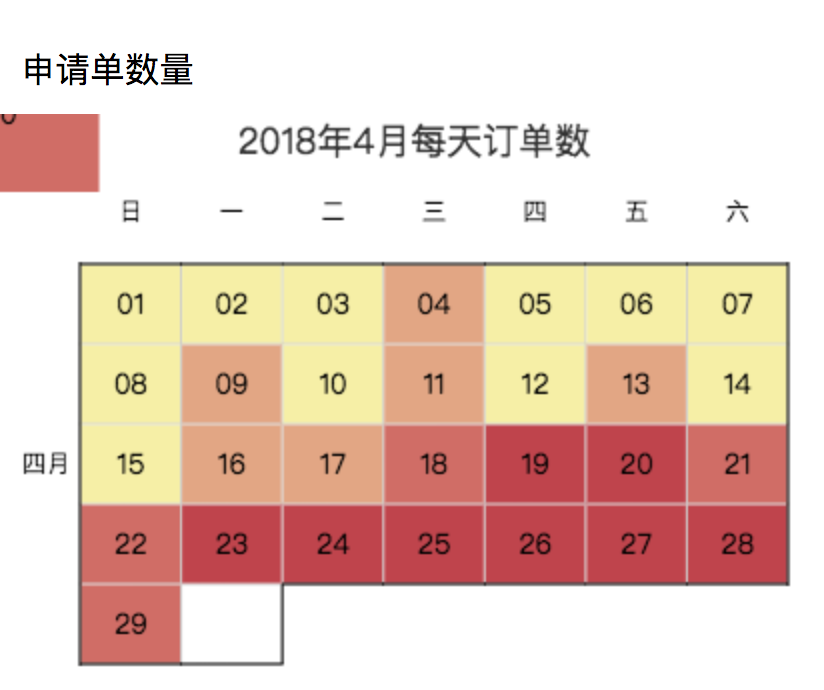
小程序日历坐标系用heatmap,最后一天渲染不全
### Version & Environment [版本及环境]
+ ECharts version [ECharts 版本]:
+ Browser version [浏览器类型和版本]:
+ OS Version [操作系统类型和版本]:
### Expected behaviour [期望结果]
### ECharts option [ECharts配置项]
<!-- Copy and paste your 'echarts option' here. -->
<!-- [下方贴你的option,注意不要删掉下方 ```javascript 和 尾部的 ``` 字样。最好是我们能够直接运行的
option。如何得到能运行的 option 参见上方的 guidelines for contributing] -->
```javascript
option = {
title: {
top: 'top',
left: 'center',
text: '2018年' + month + '月每天订单数'
},
calendar: {
top: 'middle',
left: 40,
right: 20,
cellSize: [40],
range: '2018-0' + month,
orient: 'vertical',
yearLabel: {
show: false,
},
monthLabel: {
nameMap: 'cn'
},
dayLabel: {
nameMap: 'cn'
}
},
tooltip: {
},
visualMap: {
min: 0,
max: 400,
type: 'piecewise',
orient: 'horizontal',
left: 'center',
bottom: 20,
splitNumber: 4,
},
legend: {
legend: {
data: ['工作', '娱乐', '睡觉'],
bottom: 20
}
},
series: {
type: 'heatmap',
coordinateSystem: 'calendar',
data: datas.ordernums.slice(6, 36),
label: {
show: true,
formatter: function(params) {
return echarts.format.formatTime('dd', params.value[0]);
},
textStyle: {
color: '#000',
fontSize: 14
}
}
}
}
```
### Other comments [其他信息]
<!-- For example: Screenshot or Online demo -->
<!-- [例如,截图或线上实例 (JSFiddle/JSBin/Codepen)] -->
[ Full content available at:
https://github.com/apache/incubator-echarts/issues/9024 ]
This message was relayed via gitbox.apache.org for [email protected]