### One-line summary [问题简述]
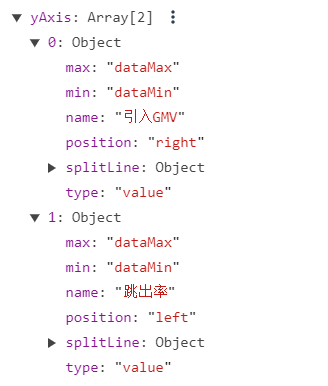
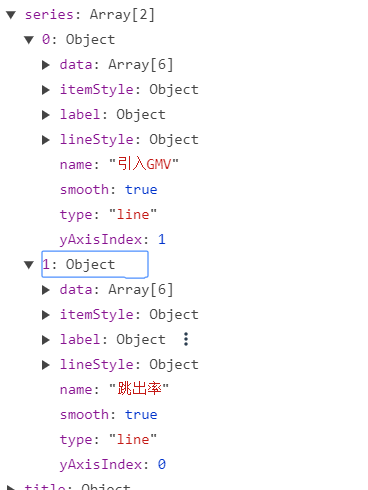
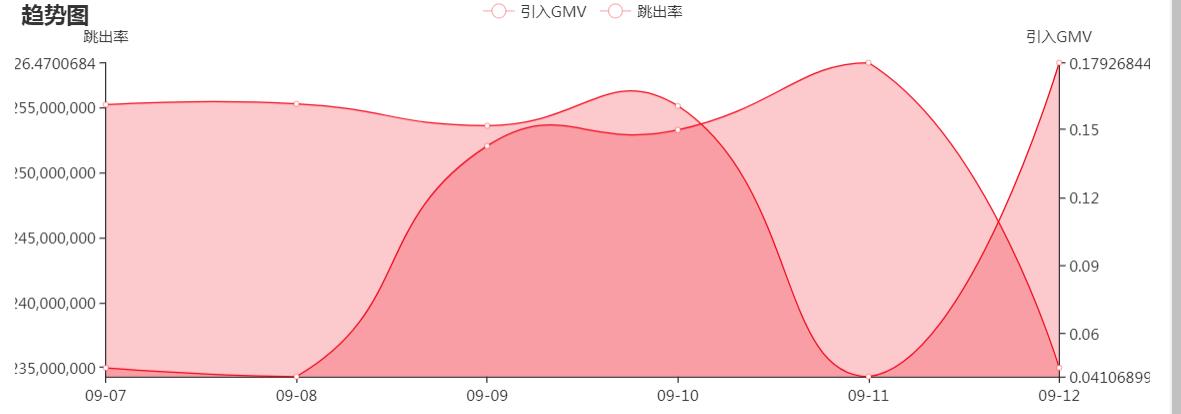
一个grid实现双y轴展示2条line,每条y轴的name和对应的刻度对调了没匹配上
### Version & Environment [版本及环境]
+ ECharts version [ECharts 版本]:4.1.0
+ Browser version [浏览器类型和版本]:chrome
+ OS Version [操作系统类型和版本]:windows
### Expected behaviour [期望结果]
每条y轴的名字和刻度对应上。如图所示,我的options中series,和yaxis是对应的,但是画出的图y轴对调了
### ECharts option [ECharts配置项]
<!-- Copy and paste your 'echarts option' here. -->
<!-- [下方贴你的option,注意不要删掉下方 ```javascript 和 尾部的 ``` 字样。最好是我们能够直接运行的
option。如何得到能运行的 option 参见上方的 guidelines for contributing] -->
```javascript
option = {
如图
}
```
### Other comments [其他信息]
[ Full content available at:
https://github.com/apache/incubator-echarts/issues/9069 ]
This message was relayed via gitbox.apache.org for [email protected]