### One-line summary [问题简述]
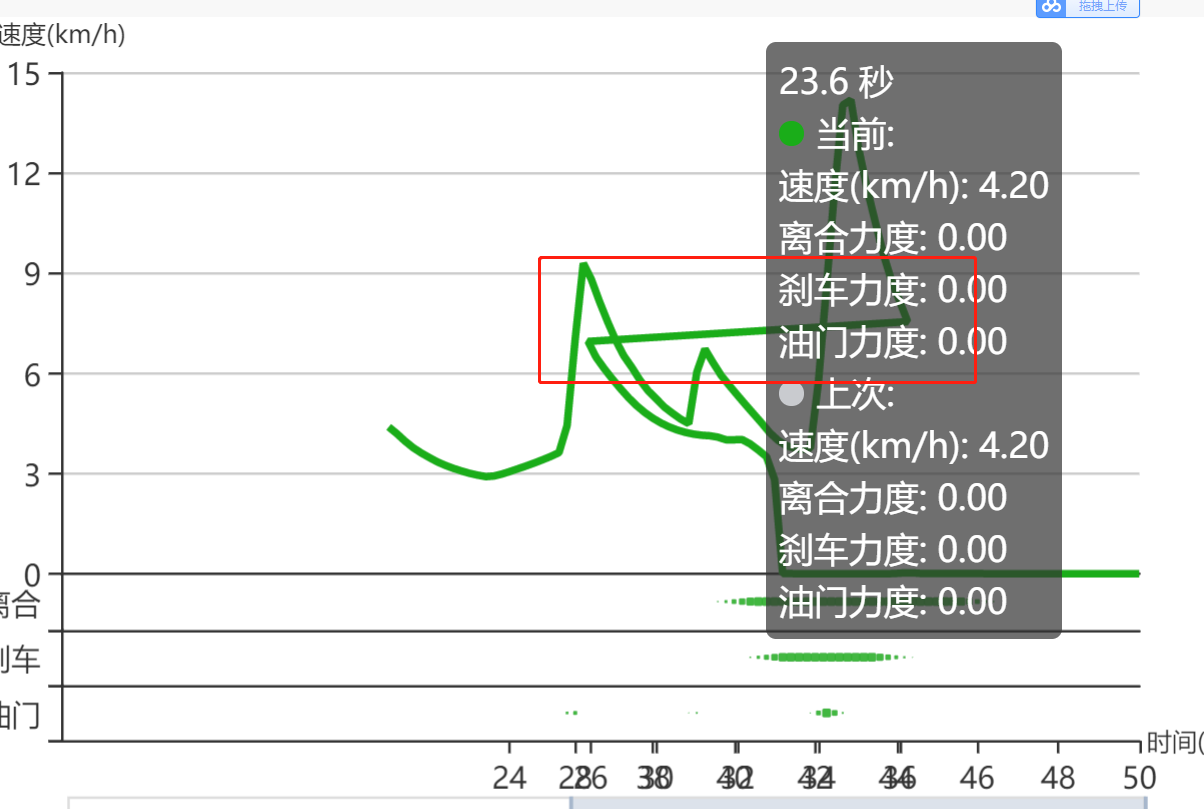
其实也不算bug...算是优化建议吧...关于dataZoom存在时, 拖动时点绘制偏移的问题...
### Version & Environment [版本及环境]
+ ECharts version [ECharts 版本]:  4.1.0
+ Browser version [浏览器类型和版本]: Mozilla/5.0 (Windows NT 10.0; WOW64)
AppleWebKit/537.36 (KHTML, like Gecko) Chrome/68.0.3440.106 Safari/537.36
+ OS Version [操作系统类型和版本]:Windows NT 10.0; WOW64


### Expected behaviour [期望结果]

当dataZoom存在时, 重新绘制不产生偏移


### ECharts option [ECharts配置项]
<!-- Copy and paste your 'echarts option' here. -->
<!-- [下方贴你的option,注意不要删掉下方 ```javascript 和 尾部的 ``` 字样。最好是我们能够直接运行的
option。如何得到能运行的 option 参见上方的 guidelines for contributing] -->
```javascript
option = {
{
        backgroundColor: '#fff',
        axisPointer: {
            link: {
                xAxisIndex: 'all',
            },
            label: {
                backgroundColor: '#777'
            }
        },
        tooltip: {
            trigger: 'axis',
            position: function (pos, params, el, elRect, size) {
                var obj = {top: 10};
                obj[['left', 'right'][+(pos[0] < size.viewSize[0] / 2)]] = 30;
                return obj;
            },
            formatter: function (params) {
                var re;
                // console.log(params);
                if(params.length == 4){
                    re =  params[0].marker+(params[0].axisValue >= 60 ?
parseInt(params[0].axisValue/60)+' 分 ': '') + (params[0].axisValue % 60 )+' 秒';
                    for(let item of params){
                        re += '<br>'+ item.seriesName + ': ' +
item.data.toFixed(2) ;
                    }
                }else if(params.length == 8){
                    re =  (params[0].axisValue >= 60 ?
parseInt(params[0].axisValue/60)+' 分 ': '') + (params[0].axisValue % 60 )+' 秒';
                    var this_time = '<br>'+params[0].marker+'当前:';
                    var last_time = '<br>'+params[1].marker+'上次:';
                    for(let item of params){
                        if(item.seriesIndex < 4){
                            this_time += '<br>'+ item.seriesName + ': ' +
item.data.toFixed(2);
                        }else{
                            last_time += '<br>'+ item.seriesName + ': ' +
item.data.toFixed(2);
                        }
                    }
                    re += this_time + last_time;
                }else{
                    var point;
                    var has_val = '';
                    for(let item of params){
                        if(!isNaN(item.data)){
                            point  = item.marker;
                            has_val += '<br>'+ item.seriesName + ': ' +
item.data.toFixed(2);
                        }
                    }
                    re = point + (params[0].axisValue >= 60 ?
parseInt(params[0].axisValue/60)+' 分 ': '') + (params[0].axisValue %
60).toFixed(1)+' 秒' + has_val;
                }
                return re;
            }
        },
        grid: [
            {
                left: '40',
                right: '40',
                top: '5%',
                height: '45%'
            },
            {
                left: '40',
                right: '40',
                top: '50%',
                height: '5%'
            },
            {
                left: '40',
                right: '40',
                top: '55%',
                height: '5%'
            },
            {
                left: '40',
                right: '40',
                top: '60%',
                height: '5%'
            }
        ],
        xAxis:[
            {
                type: 'category',
                data: xTime,
                boundaryGap: false,
                gridIndex: 0,
                axisLabel: {show: false},
                axisTick: {show: false},
            },
            {
                type: 'category',
                data: xTime,
                boundaryGap: false,
                gridIndex: 1,
                axisLabel: {show: false},
                axisTick: {show: false},
            },
            {
                type: 'category',
                data: xTime,
                boundaryGap: false,
                gridIndex: 2,
                axisLabel: {show: false},
                axisTick: {show: false},
            },
            {
                type: 'category',
                name: '时间(s)',
                data: xTime,
                boundaryGap: false,
                gridIndex: 3,
                nameGap: 3,
                nameLocation: 'end',
                nameTextStyle:{
                    fontSize: 10
                }
            }
        ],
        yAxis:[
            {
                type: 'value',
                gridIndex: 0,
                name: '速度(km/h)',
                nameGap: 10,
                nameTextStyle:{
                    fontSize: 10
                }
            },
            {
                type: 'category',
                data: ['离合'],
                gridIndex: 1,
            },
            {
                type: 'category',
                data: ['刹车'],
                gridIndex: 2,
            },
            {
                type: 'category',
                data: ['油门'],
                gridIndex: 3,
            }
        ],
        dataZoom:[
            {
                type: 'inside',
                xAxisIndex: [0, 1, 2, 3],
                start: 0,
                end: 50,
                filterMode: 'empty'
            },
            {
                show: true,
                xAxisIndex: [0, 1, 2, 3],
                type: 'slider',
                top: '70%',
                start: 0,
                end: 50,
                filterMode: 'empty'
            }
        ],
        series: [
        {
            name:'速度(km/h)',
            type: 'line',
            smooth: false,
            data: p_data[0].analysis.speed_curves.S_Points,
            xAxisIndex: 0,
            yAxisIndex: 0,
            lineStyle:{
                color: 'rgb(26, 173, 25)',
                width: 3,
            },
            itemStyle:{
                color: 'rgb(26, 173, 25)',
            },
            zlevel: 1,
        },
        {
            name:'离合力度',
            type: 'scatter',
            symbol:'roundRect',
            symbolSize: function (val) {
                return val*scatter_x;
            },
            data: p_data[0].analysis.clutch_curves.S_Points,
            xAxisIndex: 1,
            yAxisIndex: 1,
            itemStyle:{
                color: 'rgb(26, 173, 25)',
            },
            large: true,
            zlevel: 1,
        },
        {
            name:'刹车力度',
            type: 'scatter',
            symbol:'roundRect',
            symbolSize: function (val) {
                return val*scatter_x;
            },
            data: p_data[0].analysis.brake_curves.S_Points,
            xAxisIndex: 2,
            yAxisIndex: 2,
            itemStyle:{
                color: 'rgb(26, 173, 25)',
            },
            large: true,
            zlevel: 1,
        },
        {
            name:'油门力度',
            type: 'scatter',
            symbol:'roundRect',
            symbolSize: function (val) {
                return val*scatter_x;
            },
            data: p_data[0].analysis.accelerator_curves.S_Points,
            xAxisIndex: 3,
            yAxisIndex: 3,
            itemStyle:{
                color: 'rgb(26, 173, 25)',
            },
            large: true,
            zlevel: 1,
        },
    ]
    }
}

```


### Other comments [其他信息]
<!-- For example: Screenshot or Online demo -->
<!-- [例如,截图或线上实例 (JSFiddle/JSBin/Codepen)] -->

线上实例, 主要使用与移动端(PC端也可以访问), 但由于移动端性能原因, 重新绘制偏移的问题会更严重:
https://cgs.cpvrt.com/test_yb

[ Full content available at:
https://github.com/apache/incubator-echarts/issues/9070 ]
This message was relayed via gitbox.apache.org for [email protected]