Some examples: Line chart with disconnected lines for null values. Note that another metric has values for a given x-tick, so the chart "knows" that series A is null while series B has value. 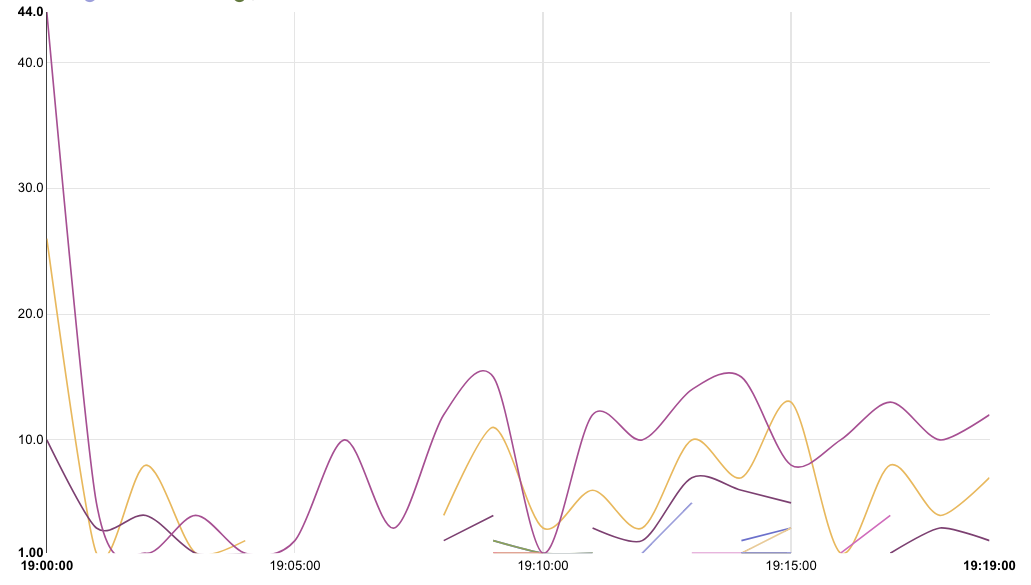
Connecting null values: There is only 1 series, missing values for Sat, Sun, and Mon. The line is drawn between the two known data points. Inserting null values should produce the same result as the above example, but with one series. 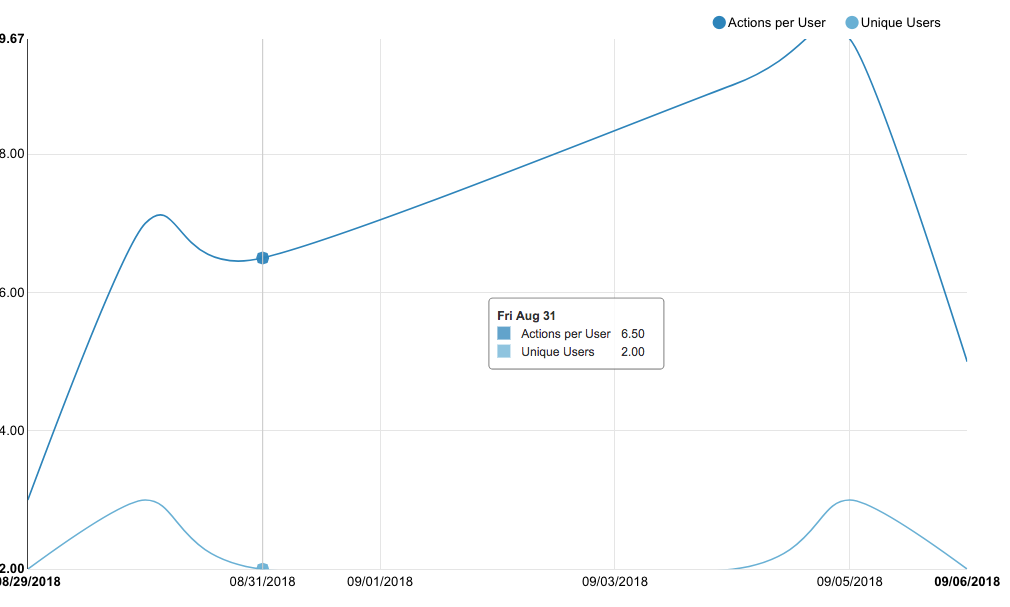 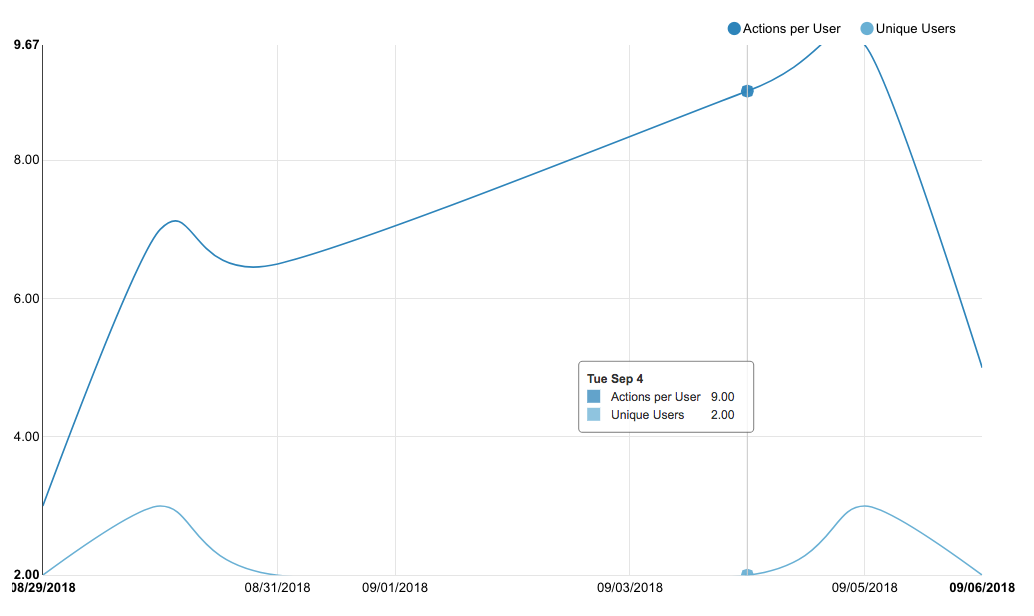 [ Full content available at: https://github.com/apache/incubator-superset/issues/5888 ] This message was relayed via gitbox.apache.org for [email protected]