<!--
为了方便我们能够复现和修复 bug,请遵从下面的规范描述您的问题。
-->
### One-line summary [问题简述]
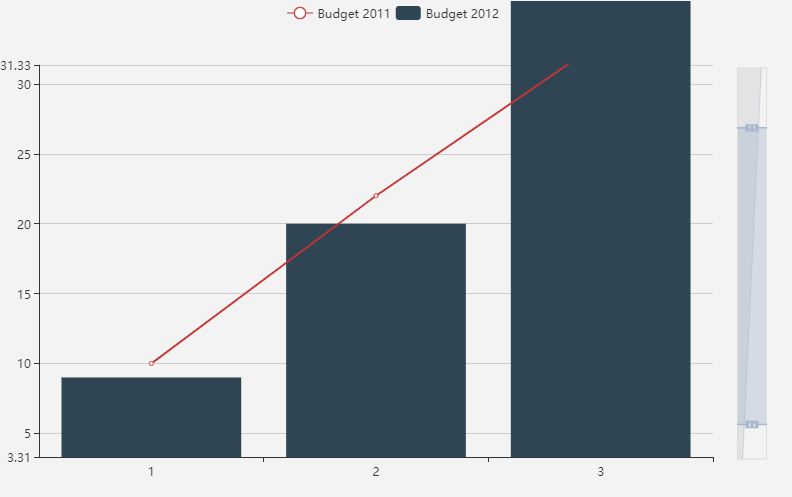
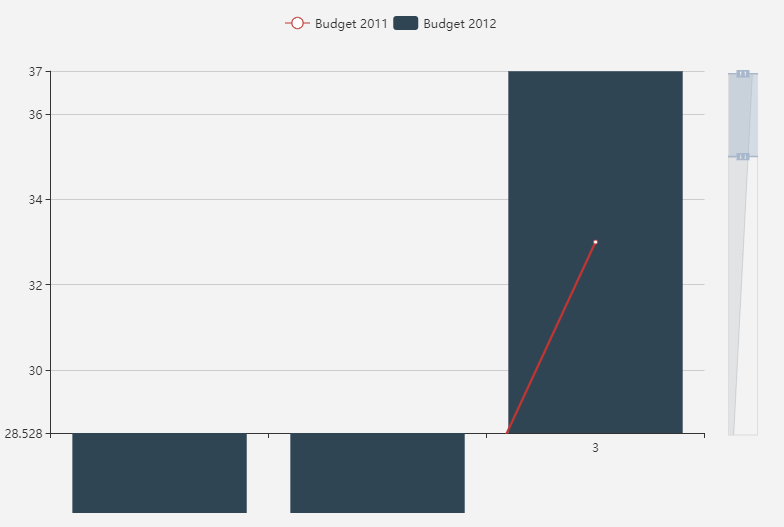
Bar chart get out grid after zoom
### Version & Environment [版本及环境]
+ ECharts version [ECharts 版本]:
+ Browser version [浏览器类型和版本]:
+ OS Version [操作系统类型和版本]:
### Expected behaviour [期望结果]
### ECharts option [ECharts配置项]
<!-- Copy and paste your 'echarts option' here. -->
<!-- [下方贴你的option,注意不要删掉下方 ```javascript 和 尾部的 ``` 字样。最好是我们能够直接运行的
option。如何得到能运行的 option 参见上方的 guidelines for contributing] -->
```javascript
option = {
tooltip : {
trigger: 'item'
},
legend: {
data: ['Budget 2011', 'Budget 2012'],
itemGap: 5
},
grid: {
top: '12%',
left: '1%',
right: '10%',
containLabel: true
},
xAxis: [
{
type : 'category',
data : [1,2,3]
}
],
yAxis: [
{
type : 'value',
}
],
dataZoom: [
{
type: 'slider',
show: true,
yAxisIndex: 0,
filterMode: 'none',
left: '93%'
}
],
series : [
{
name: 'Budget 2011',
type: 'line',
data: [10,22,33]
},
{
name: 'Budget 2012',
type: 'bar',
data: [9,20,37]
}
]
};
```
### Other comments [其他信息]
<!-- For example: Screenshot or Online demo -->
<!-- [例如,截图或线上实例 (JSFiddle/JSBin/Codepen)] -->
[ Full content available at:
https://github.com/apache/incubator-echarts/issues/9137 ]
This message was relayed via gitbox.apache.org for [email protected]