option = {

    grid: {
        left: '3%',
        right: '4%',
        bottom: '3%',
        containLabel: true
    },
    xAxis : [
        {
            type : 'category',
            boundaryGap : false,
            data : [1,2,3,4,5]
        }
    ],
    yAxis : [
        {
            type : 'value'
        }
    ],
    series : [
        {
            type:'line',
            stack: '1',
            data:[110,120, 120, 101,115]
        },
        {
            type:'line',
            stack: '1',
            label: {
                normal: {
                    show: true,
                    position: 'top'
                }
            },
            areaStyle: {normal: {}},
            data:[134,200, -20, 181,143]
        }
    ]
};
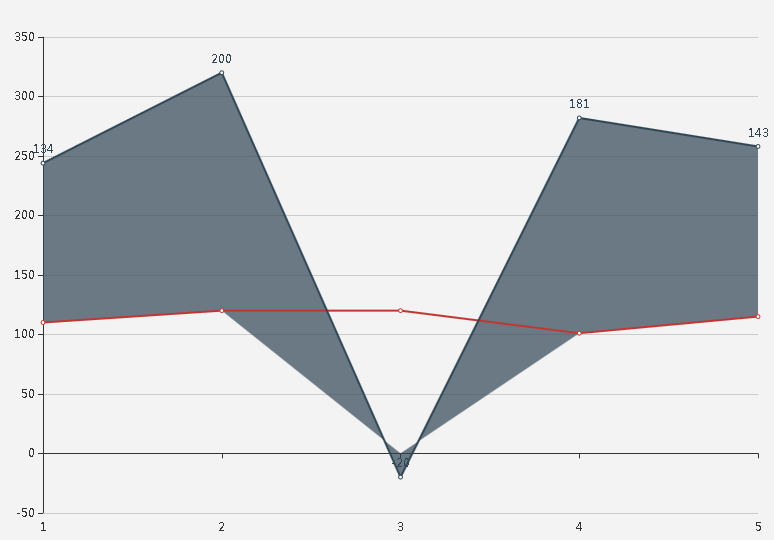
Negative areaStyle badly !!
Next:
option = {
grid: {
left: '3%',
right: '4%',
bottom: '3%',
containLabel: true
},
xAxis : [
{
type : 'category',
boundaryGap : false,
data : [1,2,3,4,5]
}
],
yAxis : [
{
type : 'value'
}
],
series : [
{
type:'line',
data:[110,120, 120, 101,115]
},
{
type:'line',
label: {
normal: {
show: true,
position: 'top'
}
},
data:[134,200, 80, 181,143]
}
]
};
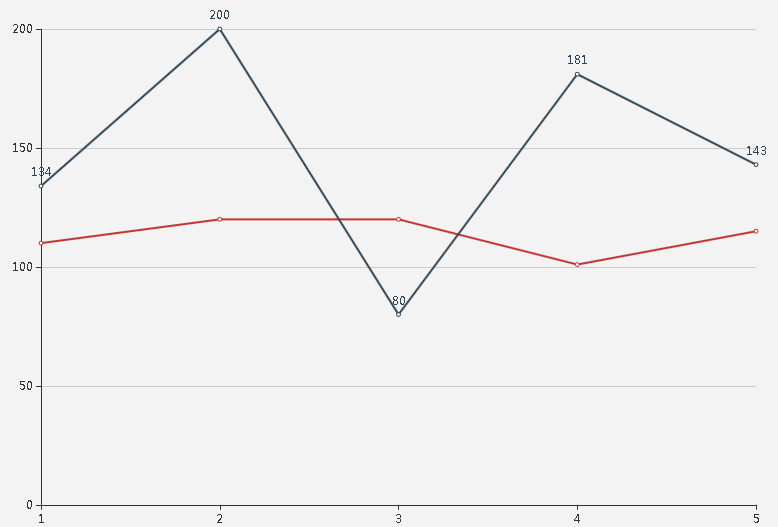
How to make:
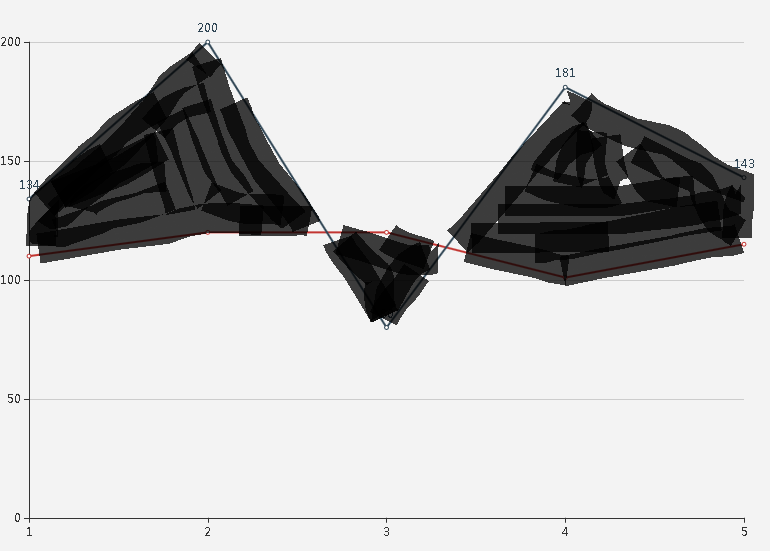
how to paint over these areas?
[ Full content available at:
https://github.com/apache/incubator-echarts/issues/9141 ]
This message was relayed via gitbox.apache.org for [email protected]