I think the code below is short enough and didactic / general purpose
enough to archive / share here on edu-sig, (c) MIT License, versus
say Github.
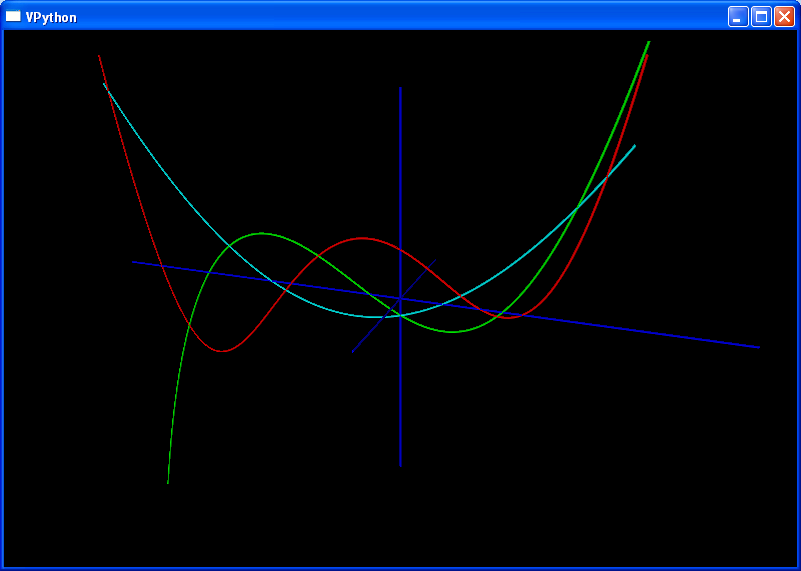
It runs with only visual (Visual Python) as a dependency, which makes
it a great demo and provides assets out of the box (simple Vector
and Edge classes) to use with that excellent package.

Then I'm going to post another demo which in turns depends on this
module, and on this one:

https://mail.python.org/pipermail/edu-sig/2013-August/010872.html

This demo will further show how to use stickworks.py (below) as a
resource.

NOTE:  some code may have word-wrapped during transport.
Perform standard maintenance before first use.

Kirby


"""
Some infrastructure for working with Vectors and Edges, including
an xyplotter generator and axes maker.

(c) By Kirby Urner, Sept 13, 2006, 2013, MIT License
# no warranty, "as is" (feel free to bring up to your own
# standards before using it to build bridges). Originally
# for learning purposes.

Updated Sept 29, 2006:
make Edge color a class-level attribute
add funky derivative demo
refactor a bit
Updated Sept 27, 2013: made Python 3.2 compatible

Original Code:
http://www.4dsolutions.net/ocn/python/stickworks.py

Video:
http://youtu.be/4iMSGKXJ_Ds

Some relevant discussion:
http://mail.python.org/pipermail/edu-sig/2006-September/007145.html
http://mail.python.org/pipermail/edu-sig/2006-September/007149.html
http://mail.python.org/pipermail/edu-sig/2006-September/007150.html
http://mail.python.org/pipermail/edu-sig/2006-September/007312.html
"""

from visual import vector, cylinder, cross, dot, diff_angle
import visual

class Vector (object):

    """
    A wrapper for visual.vector that expresses a cylinder via draw(),
    always pegged to the origin
    """

    radius = 0.03

    def __init__(self, xyz, color=(0,0,1)):
        self.v = vector(*xyz)
        self.xyz = xyz
        self.color = color
        self.cyl = None

    def draw(self):
        """define and render the cylinder"""
        self.cyl = cylinder(pos = (0,0,0), axis = self.v, radius =
self.radius, color = self.color)

    def erase(self):
        """toss the cylinder"""
        if self.cyl:
            self.cyl.visible = 0
        self.cyl = None

    def __repr__(self):
        return 'Vector @ (%s,%s,%s)' % self.xyz

    # some vector ops, including scalar multiplication

    def diff_angle(self, other):
        return self.v.diff_angle(other.v)

    def cross(self, other):
        temp = cross(self.v, other.v)
        return Vector((temp.x, temp.y, temp.z))

    def dot(self, other):
        return dot(self.v, other.v)

    def __sub__(self, other):
        temp = self.v - other.v
        return Vector((temp.x, temp.y, temp.z))

    def __add__(self, other):
        temp = self.v + other.v
        return Vector((temp.x, temp.y, temp.z))

    def __mul__(self, scalar):
        temp = self.v * scalar
        return Vector((temp.x, temp.y, temp.z))

    __rmul__ = __mul__

    def __neg__(self):
        return Vector((-self.v.x, -self.v.y, -self.v.z))

    def _length(self):
        return pow(self.v.x ** 2 + self.v.y ** 2 + self.v.z ** 2, 0.5)

    length = property(_length)

class Edge (object):

    """
    Edges are defined by two Vectors (above) and express as cylinder via
draw().
    """

    radius = 0.03
    color = (1,0,0)

    def __init__(self, v0, v1, color=None):
        if not isinstance(v0, Vector) or not isinstance(v1, Vector):
            raise TypeError("Wrong input types")
        if not color==None:
            self.color = color
        self.v0 = v0
        self.v1 = v1
        self.cyl = None

    def draw(self):
        """define and render the cylinder"""
        temp = (self.v1 - self.v0).xyz
        self.cyl = cylinder(pos = self.v0.xyz, axis = vector(*temp),
                              radius = self.radius, color = self.color)

    def erase(self):
        """toss the cylinder"""
        if self.cyl:
            self.cyl.visible = 0
        self.cyl = None

    def _length(self):
        return (self.v1 - self.v0).length

    length = property(_length)

    def __repr__(self):
        return 'Edge from %s to %s' % (self.v0, self.v1)


def xyplotter(domain, f):
    """
    domain should be an initialized generator, ready for next() triggering.
    f is any function of x.  Consecutive Vectors trace connected edges.
    """
    x0 = next(domain)
    y0  = f(x0)
    while True:
        x1 = next(domain)
        y1 =  f(x1)
        e = Edge( Vector((x0, y0, 0)), Vector((x1, y1, 0)) )
        e.draw()
        yield None
        x0, y0 = x1, y1

def axes(x=0,y=0,z=0):
    """
    Draw some axes on the VPython canvas
    """
    v0 = Vector((x,0,0))
    v0.draw()
    v0 = Vector((-x,0,0))
    v0.draw()

    v0 = Vector((0,y,0))
    v0.draw()
    v0 = Vector((0,-y,0))
    v0.draw()

    v0 = Vector((0,0,z))
    v0.draw()
    v0 = Vector((0,0,-z))
    v0.draw()


def dgen(start, step):
    """
    generic domain generator
    """
    while True:
       yield start
       start += step


def testme():
    """
    >>> from stickworks import testme
    Visual 2005-01-08
    >>> testme()

    See:
    http://www.4dsolutions.net/ocn/graphics/cosines.png
    """

    from math import cos

    def f(x):  return cos(x)

    d = dgen(-5, 0.1)
    axes(-5,1,0)
    graph = xyplotter(d, f)

    for i in xrange(100):
        graph.next()

def testmemore():
    """
    See:
    http://www.4dsolutions.net/ocn/graphics/pycalculus.png
    """

    def snakeywakey(x):
        """
        Polynomial with x-axis crossings at 3,2,-3,-7, with scaler
        to keep y-values under control (from a plotting point of view)
        """
        return 0.01 * (x-3)*(x-2)*(x+3)*(x+7)

    def deriv(f, h=1e-5):
        """
        Generic df(x)/dx approximator (discrete h)
        """
        def funk(x):
            return (f(x+h)-f(x))/h
        return funk


    d1 = dgen(-8, 0.1)
    d2 = dgen(-8, 0.1)
    d3 = dgen(-8, 0.1)

    axes(-8,5,3)

    deriv_snakeywakey = deriv(snakeywakey)
    second_deriv = deriv(deriv_snakeywakey)

    graph1 = xyplotter(d1, snakeywakey)
    graph2 = xyplotter(d2, deriv_snakeywakey)
    graph3 = xyplotter(d3, second_deriv)

    Edge.color = (1,0,0)  # make snakeywakey red

    for i in range(130):
        next(graph1)

    Edge.color = (0,1,0)  # make derivative green

    for i in range(130):
        next(graph2)

    Edge.color = (0,1,1)  # make 2nd derivative cyan

    for i in range(130):
        next(graph3)

if __name__ == '__main__':
    testmemore()
_______________________________________________
Edu-sig mailing list
[email protected]
https://mail.python.org/mailman/listinfo/edu-sig