How many indexes and how much data do you have?

Regards,
Mark Walkom
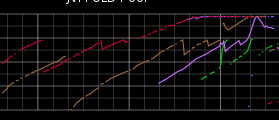
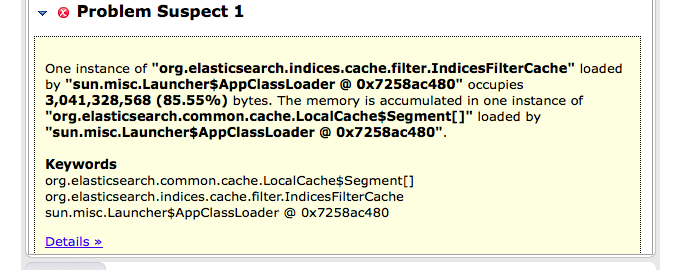
Infrastructure Engineer
Campaign Monitor
email: [email protected]
web: www.campaignmonitor.com


On 19 July 2014 01:09, Ned Campion <[email protected]> wrote:

> Hey All,
>
> I've got a cluster with 5 data nodes (2 master nodes). The cluster has
> ~100 indices, w/ doc counts in the 1k - 50k range. There is a low/medium
> amount of index load going into the cluster via the bulk api and a large
> amount of search traffic going in in the 40K queries per second range.
>
> I'm running these data nodes on ec2 (c3.8xl's) with a 30GB heap, though at
> the time of the following sample I was testing out running with a 20GB
> heap. The process runs well for a while, a couple hours to a day or two
> depending on traffic, and then it get's into a bad state where there is
> continual doing long gc runs, ie every minute doing a stop the world run
> for 30-45sec, and seemingly getting very little out of it (ie starting with
> 18.8GB heap usage and going to 18.3GB heap usage).
>
> Here the red line is a data node that is exhibiting the behavior. This is
> a graph of the "old" generation growing to nearly the complete heap size
> and then staying there for hours. During this time the application is
> severely degraded.
>
>
> <https://lh4.googleusercontent.com/-JXEVIJVBDDY/U8kyUY7hhyI/AAAAAAAACBo/dceW7JJGKiA/s1600/Screen+Shot+2014-07-18+at+10.37.44+AM.png>
>
> Example of one of the gc runs during this time (again they run every
> minute or so).
>
> [2014-07-18 00:24:24,735][WARN ][monitor.jvm ] [prod-targeting-es2]
> [gc][old][10799][27] duration [41.5s], collections [1]/[42.5s], total
> [41.5s]/[2.2m], memory [18.8gb]->[18.3gb]/[19.8gb], all_pools {[young]
> [733.2mb]->[249.9mb]/[1.4gb]}{[survivor] [86mb]->[0b]/[191.3mb]}{[old]
> [18gb]->[18.1gb]/[18.1gb]}
>
> We are running es 1.2.2 . We had been running Oracle 7u25 and we've tried
> upgrading to 7u65 with no effect. I just did a heap dump analysis using
> jmap and Eclipse Memory Analyzer and found that 85% of the heap was taken
> up with filter cache
>
>
>
> <https://lh4.googleusercontent.com/-KZ8SJD-o32M/U8kzdtC0KhI/AAAAAAAACBw/TeWTvmOc1rc/s1600/Screen+Shot+2014-07-18+at+1.34.44+AM.png>
>
> We are doing a lot of "bool" conditions in our queries, so that may be a
> factor in the hefty filter cache.
>
> Any ideas out there? Right now I have to bounce my data nodes every hour
> or two to ensure I don't reach this degraded state.
>
>
>  --
> You received this message because you are subscribed to the Google Groups
> "elasticsearch" group.
> To unsubscribe from this group and stop receiving emails from it, send an
> email to [email protected].
> To view this discussion on the web visit
> https://groups.google.com/d/msgid/elasticsearch/288da6e7-b85a-4cbf-a83d-d777ee7c9c57%40googlegroups.com
> <https://groups.google.com/d/msgid/elasticsearch/288da6e7-b85a-4cbf-a83d-d777ee7c9c57%40googlegroups.com?utm_medium=email&utm_source=footer>
> .
> For more options, visit https://groups.google.com/d/optout.
>

--
You received this message because you are subscribed to the Google Groups
"elasticsearch" group.
To unsubscribe from this group and stop receiving emails from it, send an email
to [email protected].
To view this discussion on the web visit
https://groups.google.com/d/msgid/elasticsearch/CAEM624ajsDAZMbKxR1%2Bck149OjJrgfhwDqsATbT9PFpZCkbHPA%40mail.gmail.com.
For more options, visit https://groups.google.com/d/optout.