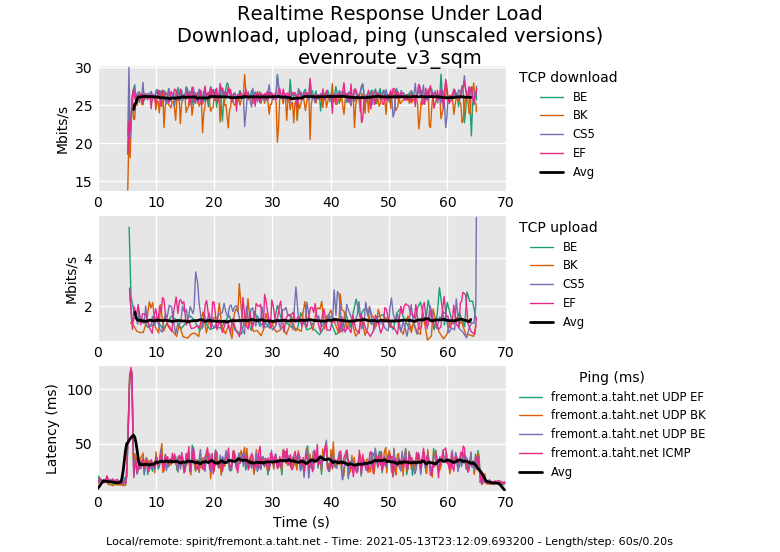
Naive readers of a rrul plot tend to look at the average, when, especially when
you are trying to describe the difference between a good plot of latency and
jitter
[a good sch_fq plot of latency and
jitter](http://dallas.starlink.taht.net/virtio_nobql/rrul_-_evenroute_v3_server_fq.png)
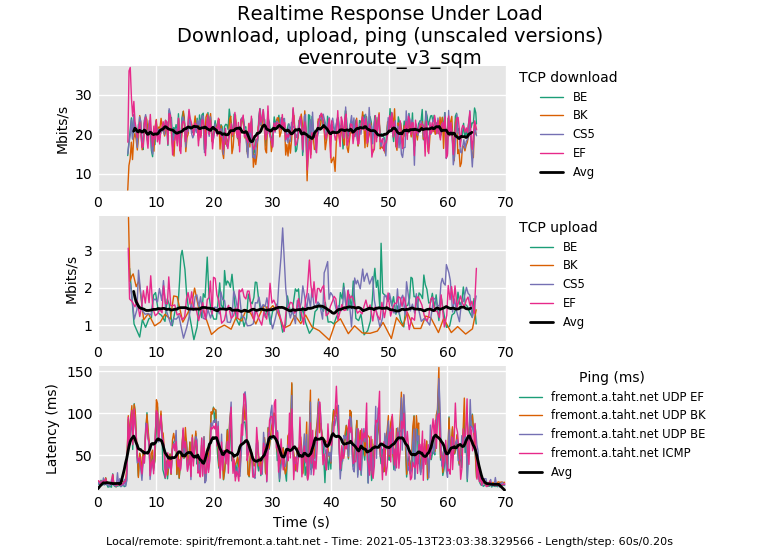
and
[The Terrifying FQ_CODEL BQL
BUG](http://dallas.starlink.taht.net/virtio_nobql/rrul_-_evenroute_v3_server_fq_codel.png)
To a manager type that wants to pull you off onto doing some irrelevant study
of something of far less import to the correct behavior of 10s of millions of
machines and of the internet itself and threatens to fire you if you are not
going to comply... would help. rrul_max perhaps?
--
You are receiving this because you are subscribed to this thread.
Reply to this email directly or view it on GitHub:
https://github.com/tohojo/flent/issues/225
_______________________________________________
Flent-users mailing list -- flent-users@flent.org
To unsubscribe send an email to flent-users-le...@flent.org