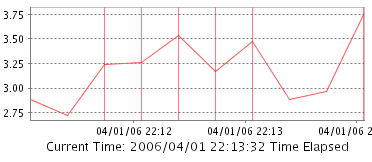
I am developing a charting application. I am simulating a live chart which is updated after finite interval. X-Axis of the chart is going to have dates and Y-Axis will have Numbers. I want to put a red line marker when the value of Y-axis crosses a particular value. Sample image is attached.
Is it possible to do this using Flex line charting?
Thanks,
Sachin
--
Flexcoders Mailing List
FAQ: http://groups.yahoo.com/group/flexcoders/files/flexcodersFAQ.txt
Search Archives: http://www.mail-archive.com/flexcoders%40yahoogroups.com
SPONSORED LINKS
| Web site design development | Computer software development | Software design and development |
| Macromedia flex | Software development best practice |
YAHOO! GROUPS LINKS
- Visit your group "flexcoders" on the web.
- To unsubscribe from this group, send an email to:
[EMAIL PROTECTED]
- Your use of Yahoo! Groups is subject to the Yahoo! Terms of Service.
![]() Markers.PNG
Markers.PNG
Description: PNG image