On Fri, Aug 31, 2018 at 1:18 PM Hu Bert <[email protected]> wrote:
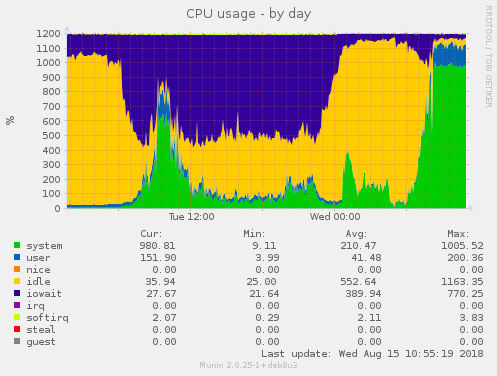
> Hi Pranith,
>
> i just wanted to ask if you were able to get any feedback from your
> colleagues :-)
>

Sorry, I didn't get a chance to. I am working on a customer issue which is
taking away cycles from any other work. Let me get back to you once I get
time this week.


>
> btw.: we migrated some stuff (static resources, small files) to a nfs
> server that we actually wanted to replace by glusterfs. Load and cpu
> usage has gone down a bit, but still is asymmetric on the 3 gluster
> servers.
>
>
> 2018-08-28 9:24 GMT+02:00 Hu Bert <[email protected]>:
> > Hm, i noticed that in the shared.log (volume log file) on gluster11
> > and gluster12 (but not on gluster13) i now see these warnings:
> >
> > [2018-08-28 07:18:57.224367] W [MSGID: 109011]
> > [dht-layout.c:186:dht_layout_search] 0-shared-dht: no subvolume for
> > hash (value) = 3054593291
> > [2018-08-28 07:19:17.733625] W [MSGID: 109011]
> > [dht-layout.c:186:dht_layout_search] 0-shared-dht: no subvolume for
> > hash (value) = 2595205890
> > [2018-08-28 07:19:27.950355] W [MSGID: 109011]
> > [dht-layout.c:186:dht_layout_search] 0-shared-dht: no subvolume for
> > hash (value) = 3105728076
> > [2018-08-28 07:19:42.519010] W [MSGID: 109011]
> > [dht-layout.c:186:dht_layout_search] 0-shared-dht: no subvolume for
> > hash (value) = 3740415196
> > [2018-08-28 07:19:48.194774] W [MSGID: 109011]
> > [dht-layout.c:186:dht_layout_search] 0-shared-dht: no subvolume for
> > hash (value) = 2922795043
> > [2018-08-28 07:19:52.506135] W [MSGID: 109011]
> > [dht-layout.c:186:dht_layout_search] 0-shared-dht: no subvolume for
> > hash (value) = 2841655539
> > [2018-08-28 07:19:55.466352] W [MSGID: 109011]
> > [dht-layout.c:186:dht_layout_search] 0-shared-dht: no subvolume for
> > hash (value) = 3049465001
> >
> > Don't know if that could be related.
> >
> >
> > 2018-08-28 8:54 GMT+02:00 Hu Bert <[email protected]>:
> >> a little update after about 2 hours of uptime: still/again high cpu
> >> usage by one brick processes. server load >30.
> >>
> >> gluster11: high cpu; brick /gluster/bricksdd1/; no hdd exchange so far
> >> gluster12: normal cpu; brick /gluster/bricksdd1_new/; hdd change
> /dev/sdd
> >> gluster13: high cpu; brick /gluster/bricksdd1_new/; hdd change /dev/sdd
> >>
> >> The process for brick bricksdd1 consumes almost all 12 cores.
> >> Interestingly there are more threads for the bricksdd1 process than
> >> for the other bricks. Counted with "ps huH p <PID_OF_U_PROCESS> | wc
> >> -l"
> >>
> >> gluster11:
> >> bricksda1 59 threads, bricksdb1 65 threads, bricksdc1 68 threads,
> >> bricksdd1 85 threads
> >> gluster12:
> >> bricksda1 65 threads, bricksdb1 60 threads, bricksdc1 61 threads,
> >> bricksdd1_new 58 threads
> >> gluster13:
> >> bricksda1 61 threads, bricksdb1 60 threads, bricksdc1 61 threads,
> >> bricksdd1_new 82 threads
> >>
> >> Don't know if that could be relevant.
> >>
> >> 2018-08-28 7:04 GMT+02:00 Hu Bert <[email protected]>:
> >>> Good Morning,
> >>>
> >>> today i update + rebooted all gluster servers, kernel update to
> >>> 4.9.0-8 and gluster to 3.12.13. Reboots went fine, but on one of the
> >>> gluster servers (gluster13) one of the bricks did come up at the
> >>> beginning but then lost connection.
> >>>
> >>> OK:
> >>>
> >>> Status of volume: shared
> >>> Gluster process                             TCP Port  RDMA Port
> Online  Pid
> >>>
> ------------------------------------------------------------------------------
> >>> [...]
> >>> Brick gluster11:/gluster/bricksdd1/shared             49155     0
> >>>     Y       2506
> >>> Brick gluster12:/gluster/bricksdd1_new/shared    49155     0
> >>> Y       2097
> >>> Brick gluster13:/gluster/bricksdd1_new/shared    49155     0
> >>> Y       2136
> >>>
> >>> Lost connection:
> >>>
> >>> Brick gluster11:/gluster/bricksdd1/shared              49155     0
> >>>      Y       2506
> >>> Brick gluster12:/gluster/bricksdd1_new/shared     49155     0
> >>> Y       2097
> >>> Brick gluster13:/gluster/bricksdd1_new/shared     N/A       N/A
> >>> N       N/A
> >>>
> >>> gluster volume heal shared info:
> >>> Brick gluster13:/gluster/bricksdd1_new/shared
> >>> Status: Transport endpoint is not connected
> >>> Number of entries: -
> >>>
> >>> reboot was at 06:15:39; brick then worked for a short period, but then
> >>> somehow disconnected.
> >>>
> >>> from gluster13:/var/log/glusterfs/glusterd.log:
> >>>
> >>> [2018-08-28 04:27:36.944608] I [MSGID: 106005]
> >>> [glusterd-handler.c:6071:__glusterd_brick_rpc_notify] 0-management:
> >>> Brick gluster13:/gluster/bricksdd1_new/shared has disconnected from
> >>> glusterd.
> >>> [2018-08-28 04:28:57.869666] I
> >>> [glusterd-utils.c:6056:glusterd_brick_start] 0-management: starting a
> >>> fresh brick process for brick /gluster/bricksdd1_new/shared
> >>> [2018-08-28 04:35:20.732666] I [MSGID: 106143]
> >>> [glusterd-pmap.c:295:pmap_registry_bind] 0-pmap: adding brick
> >>> /gluster/bricksdd1_new/shared on port 49157
> >>>
> >>> After 'gluster volume start shared force' (then with new port 49157):
> >>>
> >>> Brick gluster11:/gluster/bricksdd1/shared               49155     0
> >>>       Y       2506
> >>> Brick gluster12:/gluster/bricksdd1_new/shared      49155     0
> >>>  Y       2097
> >>> Brick gluster13:/gluster/bricksdd1_new/shared      49157     0
> >>>  Y       3994
> >>>
> >>> from /var/log/syslog:
> >>>
> >>> Aug 28 06:27:36 gluster13 gluster-bricksdd1_new-shared[2136]: pending
> frames:
> >>> Aug 28 06:27:36 gluster13 gluster-bricksdd1_new-shared[2136]: frame :
> >>> type(0) op(0)
> >>> Aug 28 06:27:36 gluster13 gluster-bricksdd1_new-shared[2136]: frame :
> >>> type(0) op(0)
> >>> Aug 28 06:27:36 gluster13 gluster-bricksdd1_new-shared[2136]:
> >>> patchset: git://git.gluster.org/glusterfs.git
> >>> Aug 28 06:27:36 gluster13 gluster-bricksdd1_new-shared[2136]: signal
> >>> received: 11
> >>> Aug 28 06:27:36 gluster13 gluster-bricksdd1_new-shared[2136]: time of
> crash:
> >>> Aug 28 06:27:36 gluster13 gluster-bricksdd1_new-shared[2136]:
> >>> 2018-08-28 04:27:36
> >>> Aug 28 06:27:36 gluster13 gluster-bricksdd1_new-shared[2136]:
> >>> configuration details:
> >>> Aug 28 06:27:36 gluster13 gluster-bricksdd1_new-shared[2136]: argp 1
> >>> Aug 28 06:27:36 gluster13 gluster-bricksdd1_new-shared[2136]:
> backtrace 1
> >>> Aug 28 06:27:36 gluster13 gluster-bricksdd1_new-shared[2136]: dlfcn 1
> >>> Aug 28 06:27:36 gluster13 gluster-bricksdd1_new-shared[2136]:
> libpthread 1
> >>> Aug 28 06:27:36 gluster13 gluster-bricksdd1_new-shared[2136]:
> llistxattr 1
> >>> Aug 28 06:27:36 gluster13 gluster-bricksdd1_new-shared[2136]: setfsid 1
> >>> Aug 28 06:27:36 gluster13 gluster-bricksdd1_new-shared[2136]: spinlock
> 1
> >>> Aug 28 06:27:36 gluster13 gluster-bricksdd1_new-shared[2136]: epoll.h 1
> >>> Aug 28 06:27:36 gluster13 gluster-bricksdd1_new-shared[2136]: xattr.h 1
> >>> Aug 28 06:27:36 gluster13 gluster-bricksdd1_new-shared[2136]:
> st_atim.tv_nsec 1
> >>> Aug 28 06:27:36 gluster13 gluster-bricksdd1_new-shared[2136]:
> >>> package-string: glusterfs 3.12.13
> >>> Aug 28 06:27:36 gluster13 gluster-bricksdd1_new-shared[2136]: ---------
> >>>
> >>> There are some errors+warnings in the shared.log (volume logfile), but
> >>> no error message telling me why
> >>> gluster13:/gluster/bricksdd1_new/shared has disconnected.
> >>>
> >>> Well... at the moment load is ok, all 3 servers at about 15 (but i
> >>> think it will go up when more users will cause more traffic -> more
> >>> work on servers), 'gluster volume heal shared info' shows no entries,
> >>> status:
> >>>
> >>> Status of volume: shared
> >>> Gluster process                             TCP Port  RDMA Port
> Online  Pid
> >>>
> ------------------------------------------------------------------------------
> >>> Brick gluster11:/gluster/bricksda1/shared   49152     0          Y
>    2482
> >>> Brick gluster12:/gluster/bricksda1/shared   49152     0          Y
>    2088
> >>> Brick gluster13:/gluster/bricksda1/shared   49152     0          Y
>    2115
> >>> Brick gluster11:/gluster/bricksdb1/shared   49153     0          Y
>    2489
> >>> Brick gluster12:/gluster/bricksdb1/shared   49153     0          Y
>    2094
> >>> Brick gluster13:/gluster/bricksdb1/shared   49153     0          Y
>    2116
> >>> Brick gluster11:/gluster/bricksdc1/shared   49154     0          Y
>    2497
> >>> Brick gluster12:/gluster/bricksdc1/shared   49154     0          Y
>    2095
> >>> Brick gluster13:/gluster/bricksdc1/shared   49154     0          Y
>    2127
> >>> Brick gluster11:/gluster/bricksdd1/shared   49155     0          Y
>    2506
> >>> Brick gluster12:/gluster/bricksdd1_new/shared     49155     0
> >>> Y       2097
> >>> Brick gluster13:/gluster/bricksdd1_new/shared     49157     0
> >>> Y       3994
> >>> Self-heal Daemon on localhost               N/A       N/A        Y
>    4868
> >>> Self-heal Daemon on gluster12               N/A       N/A        Y
>    3813
> >>> Self-heal Daemon on gluster11               N/A       N/A        Y
>    5762
> >>>
> >>> Task Status of Volume shared
> >>>
> ------------------------------------------------------------------------------
> >>> There are no active volume tasks
> >>>
> >>> Very strange. Thanks for reading if you've reached this line :-)
> >>>
> >>> 2018-08-23 13:58 GMT+02:00 Pranith Kumar Karampuri <
> [email protected]>:
> >>>>
> >>>>
> >>>> On Wed, Aug 22, 2018 at 12:01 PM Hu Bert <[email protected]>
> wrote:
> >>>>>
> >>>>> Just an addition: in general there are no log messages in
> >>>>> /var/log/glusterfs/ (if you don't all 'gluster volume ...'), but on
> >>>>> the node with the lowest load i see in cli.log.1:
> >>>>>
> >>>>> [2018-08-22 06:20:43.291055] I [socket.c:2474:socket_event_handler]
> >>>>> 0-transport: EPOLLERR - disconnecting now
> >>>>> [2018-08-22 06:20:46.291327] I [socket.c:2474:socket_event_handler]
> >>>>> 0-transport: EPOLLERR - disconnecting now
> >>>>> [2018-08-22 06:20:49.291575] I [socket.c:2474:socket_event_handler]
> >>>>> 0-transport: EPOLLERR - disconnecting now
> >>>>>
> >>>>> every 3 seconds. Looks like this bug:
> >>>>> https://bugzilla.redhat.com/show_bug.cgi?id=1484885 - but that shoud
> >>>>> have been fixed in the 3.12.x release, and network is fine.
> >>>>
> >>>>
> >>>> +Milind Changire
> >>>>
> >>>>>
> >>>>> In cli.log there are only these entries:
> >>>>>
> >>>>> [2018-08-22 06:19:23.428520] I [cli.c:765:main] 0-cli: Started
> running
> >>>>> gluster with version 3.12.12
> >>>>> [2018-08-22 06:19:23.800895] I [MSGID: 101190]
> >>>>> [event-epoll.c:613:event_dispatch_epoll_worker] 0-epoll: Started
> >>>>> thread with index 1
> >>>>> [2018-08-22 06:19:23.800978] I [socket.c:2474:socket_event_handler]
> >>>>> 0-transport: EPOLLERR - disconnecting now
> >>>>> [2018-08-22 06:19:23.809366] I [input.c:31:cli_batch] 0-: Exiting
> with: 0
> >>>>>
> >>>>> Just wondered if this could related anyhow.
> >>>>>
> >>>>> 2018-08-21 8:17 GMT+02:00 Pranith Kumar Karampuri <
> [email protected]>:
> >>>>> >
> >>>>> >
> >>>>> > On Tue, Aug 21, 2018 at 11:40 AM Hu Bert <[email protected]>
> wrote:
> >>>>> >>
> >>>>> >> Good morning :-)
> >>>>> >>
> >>>>> >> gluster11:
> >>>>> >> ls -l /gluster/bricksdd1/shared/.glusterfs/indices/xattrop/
> >>>>> >> total 0
> >>>>> >> ---------- 1 root root 0 Aug 14 06:14
> >>>>> >> xattrop-006b65d8-9e81-4886-b380-89168ea079bd
> >>>>> >>
> >>>>> >> gluster12:
> >>>>> >> ls -l /gluster/bricksdd1_new/shared/.glusterfs/indices/xattrop/
> >>>>> >> total 0
> >>>>> >> ---------- 1 root root 0 Jul 17 11:24
> >>>>> >> xattrop-c7c6f765-ce17-4361-95fb-2fd7f31c7b82
> >>>>> >>
> >>>>> >> gluster13:
> >>>>> >> ls -l /gluster/bricksdd1_new/shared/.glusterfs/indices/xattrop/
> >>>>> >> total 0
> >>>>> >> ---------- 1 root root 0 Aug 16 07:54
> >>>>> >> xattrop-16b696a0-4214-4999-b277-0917c76c983e
> >>>>> >>
> >>>>> >>
> >>>>> >> And here's the output of 'perf ...' which ran almost a minute -
> file
> >>>>> >> grew pretty fast to a size of 17 GB and system load went up
> heavily.
> >>>>> >> Had to wait a while until load dropped :-)
> >>>>> >>
> >>>>> >> fyi - load at the moment:
> >>>>> >> load gluster11: ~90
> >>>>> >> load gluster12: ~10
> >>>>> >> load gluster13: ~50
> >>>>> >>
> >>>>> >> perf record --call-graph=dwarf -p 7897 -o
> >>>>> >> /tmp/perf.gluster11.bricksdd1.out
> >>>>> >> [ perf record: Woken up 9837 times to write data ]
> >>>>> >> Warning:
> >>>>> >> Processed 2137218 events and lost 33446 chunks!
> >>>>> >>
> >>>>> >> Check IO/CPU overload!
> >>>>> >>
> >>>>> >> [ perf record: Captured and wrote 16576.374 MB
> >>>>> >> /tmp/perf.gluster11.bricksdd1.out (2047760 samples) ]
> >>>>> >>
> >>>>> >> Here's an excerpt.
> >>>>> >>
> >>>>> >> +    1.93%     0.00%  glusteriotwr0    [unknown]              [k]
> >>>>> >> 0xffffffffffffffff
> >>>>> >> +    1.89%     0.00%  glusteriotwr28   [unknown]              [k]
> >>>>> >> 0xffffffffffffffff
> >>>>> >> +    1.86%     0.00%  glusteriotwr15   [unknown]              [k]
> >>>>> >> 0xffffffffffffffff
> >>>>> >> +    1.85%     0.00%  glusteriotwr63   [unknown]              [k]
> >>>>> >> 0xffffffffffffffff
> >>>>> >> +    1.83%     0.01%  glusteriotwr0    [kernel.kallsyms]      [k]
> >>>>> >> entry_SYSCALL_64_after_swapgs
> >>>>> >> +    1.82%     0.00%  glusteriotwr38   [unknown]              [k]
> >>>>> >> 0xffffffffffffffff
> >>>>> >> +    1.82%     0.01%  glusteriotwr28   [kernel.kallsyms]      [k]
> >>>>> >> entry_SYSCALL_64_after_swapgs
> >>>>> >> +    1.82%     0.00%  glusteriotwr0    [kernel.kallsyms]      [k]
> >>>>> >> do_syscall_64
> >>>>> >> +    1.81%     0.00%  glusteriotwr28   [kernel.kallsyms]      [k]
> >>>>> >> do_syscall_64
> >>>>> >> +    1.81%     0.00%  glusteriotwr15   [kernel.kallsyms]      [k]
> >>>>> >> entry_SYSCALL_64_after_swapgs
> >>>>> >> +    1.81%     0.00%  glusteriotwr36   [unknown]              [k]
> >>>>> >> 0xffffffffffffffff
> >>>>> >> +    1.80%     0.00%  glusteriotwr15   [kernel.kallsyms]      [k]
> >>>>> >> do_syscall_64
> >>>>> >> +    1.78%     0.01%  glusteriotwr63   [kernel.kallsyms]      [k]
> >>>>> >> entry_SYSCALL_64_after_swapgs
> >>>>> >> +    1.77%     0.00%  glusteriotwr63   [kernel.kallsyms]      [k]
> >>>>> >> do_syscall_64
> >>>>> >> +    1.75%     0.01%  glusteriotwr38   [kernel.kallsyms]      [k]
> >>>>> >> entry_SYSCALL_64_after_swapgs
> >>>>> >> +    1.75%     0.00%  glusteriotwr38   [kernel.kallsyms]      [k]
> >>>>> >> do_syscall_64
> >>>>> >> +    1.74%     0.00%  glusteriotwr17   [unknown]              [k]
> >>>>> >> 0xffffffffffffffff
> >>>>> >> +    1.74%     0.00%  glusteriotwr44   [unknown]              [k]
> >>>>> >> 0xffffffffffffffff
> >>>>> >> +    1.73%     0.00%  glusteriotwr6    [unknown]              [k]
> >>>>> >> 0xffffffffffffffff
> >>>>> >> +    1.73%     0.00%  glusteriotwr37   [unknown]              [k]
> >>>>> >> 0xffffffffffffffff
> >>>>> >> +    1.73%     0.01%  glusteriotwr36   [kernel.kallsyms]      [k]
> >>>>> >> entry_SYSCALL_64_after_swapgs
> >>>>> >> +    1.72%     0.00%  glusteriotwr34   [unknown]              [k]
> >>>>> >> 0xffffffffffffffff
> >>>>> >> +    1.72%     0.00%  glusteriotwr36   [kernel.kallsyms]      [k]
> >>>>> >> do_syscall_64
> >>>>> >> +    1.71%     0.00%  glusteriotwr45   [unknown]              [k]
> >>>>> >> 0xffffffffffffffff
> >>>>> >> +    1.70%     0.00%  glusteriotwr7    [unknown]              [k]
> >>>>> >> 0xffffffffffffffff
> >>>>> >> +    1.68%     0.00%  glusteriotwr15   [kernel.kallsyms]      [k]
> >>>>> >> sys_getdents
> >>>>> >> +    1.68%     0.00%  glusteriotwr15   [kernel.kallsyms]      [k]
> >>>>> >> filldir
> >>>>> >> +    1.68%     0.00%  glusteriotwr15   libc-2.24.so           [.]
> >>>>> >> 0xffff80c60db8ef2b
> >>>>> >> +    1.68%     0.00%  glusteriotwr15   libc-2.24.so           [.]
> >>>>> >> readdir64
> >>>>> >> +    1.68%     0.00%  glusteriotwr15   index.so               [.]
> >>>>> >> 0xffff80c6192a1888
> >>>>> >> +    1.68%     0.00%  glusteriotwr15   [kernel.kallsyms]      [k]
> >>>>> >> iterate_dir
> >>>>> >> +    1.68%     0.00%  glusteriotwr15   [kernel.kallsyms]      [k]
> >>>>> >> ext4_htree_fill_tree
> >>>>> >> +    1.68%     0.00%  glusteriotwr15   [kernel.kallsyms]      [k]
> >>>>> >> ext4_readdir
> >>>>> >>
> >>>>> >> Or do you want to download the file
> /tmp/perf.gluster11.bricksdd1.out
> >>>>> >> and examine it yourself? If so i could send you a link.
> >>>>> >
> >>>>> >
> >>>>> > Thank you! yes a link would be great. I am not as good with kernel
> side
> >>>>> > of
> >>>>> > things. So I will have to show this information to someone else who
> >>>>> > knows
> >>>>> > these things so expect delay in response.
> >>>>> >
> >>>>> >>
> >>>>> >>
> >>>>> >>
> >>>>> >> 2018-08-21 7:13 GMT+02:00 Pranith Kumar Karampuri
> >>>>> >> <[email protected]>:
> >>>>> >> >
> >>>>> >> >
> >>>>> >> > On Tue, Aug 21, 2018 at 10:13 AM Pranith Kumar Karampuri
> >>>>> >> > <[email protected]> wrote:
> >>>>> >> >>
> >>>>> >> >>
> >>>>> >> >>
> >>>>> >> >> On Mon, Aug 20, 2018 at 3:20 PM Hu Bert <
> [email protected]>
> >>>>> >> >> wrote:
> >>>>> >> >>>
> >>>>> >> >>> Regarding hardware the machines are identical. Intel Xeon
> E5-1650
> >>>>> >> >>> v3
> >>>>> >> >>> Hexa-Core; 64 GB DDR4 ECC; Dell PERC H330 8 Port SAS/SATA 12
> GBit/s
> >>>>> >> >>> RAID Controller; operating system running on a raid1, then 4
> disks
> >>>>> >> >>> (JBOD) as bricks.
> >>>>> >> >>>
> >>>>> >> >>> Ok, i ran perf for a few seconds.
> >>>>> >> >>>
> >>>>> >> >>> ------------------------
> >>>>> >> >>> perf record --call-graph=dwarf -p 7897 -o
> >>>>> >> >>> /tmp/perf.gluster11.bricksdd1.out
> >>>>> >> >>> ^C[ perf record: Woken up 378 times to write data ]
> >>>>> >> >>> Warning:
> >>>>> >> >>> Processed 83690 events and lost 96 chunks!
> >>>>> >> >>>
> >>>>> >> >>> Check IO/CPU overload!
> >>>>> >> >>>
> >>>>> >> >>> [ perf record: Captured and wrote 423.087 MB
> >>>>> >> >>> /tmp/perf.gluster11.bricksdd1.out (51744 samples) ]
> >>>>> >> >>> ------------------------
> >>>>> >> >>>
> >>>>> >> >>> I copied a couple of lines:
> >>>>> >> >>>
> >>>>> >> >>> +    8.10%     0.00%  glusteriotwr22   [unknown]
> [k]
> >>>>> >> >>> 0xffffffffffffffff
> >>>>> >> >>> +    8.10%     0.00%  glusteriotwr22   [kernel.kallsyms]
> [k]
> >>>>> >> >>> iterate_dir
> >>>>> >> >>> +    8.10%     0.00%  glusteriotwr22   [kernel.kallsyms]
> [k]
> >>>>> >> >>> sys_getdents
> >>>>> >> >>> +    8.10%     0.00%  glusteriotwr22   [kernel.kallsyms]
> [k]
> >>>>> >> >>> filldir
> >>>>> >> >>> +    8.10%     0.00%  glusteriotwr22   [kernel.kallsyms]
> [k]
> >>>>> >> >>> do_syscall_64
> >>>>> >> >>> +    8.10%     0.00%  glusteriotwr22   [kernel.kallsyms]
> [k]
> >>>>> >> >>> entry_SYSCALL_64_after_swapgs
> >>>>> >> >>> +    8.10%     0.00%  glusteriotwr22   libc-2.24.so
>  [.]
> >>>>> >> >>> 0xffff80c60db8ef2b
> >>>>> >> >>> +    8.10%     0.00%  glusteriotwr22   libc-2.24.so
>  [.]
> >>>>> >> >>> readdir64
> >>>>> >> >>> +    8.10%     0.00%  glusteriotwr22   index.so
>  [.]
> >>>>> >> >>> 0xffff80c6192a1888
> >>>>> >> >>> +    8.10%     0.04%  glusteriotwr22   [kernel.kallsyms]
> [k]
> >>>>> >> >>> ext4_htree_fill_tree
> >>>>> >> >>> +    8.10%     0.00%  glusteriotwr22   [kernel.kallsyms]
> [k]
> >>>>> >> >>> ext4_readdir
> >>>>> >> >>> +    7.95%     0.12%  glusteriotwr22   [kernel.kallsyms]
> [k]
> >>>>> >> >>> htree_dirblock_to_tree
> >>>>> >> >>> +    5.78%     0.96%  glusteriotwr22   [kernel.kallsyms]
> [k]
> >>>>> >> >>> __ext4_read_dirblock
> >>>>> >> >>> +    4.80%     0.02%  glusteriotwr22   [kernel.kallsyms]
> [k]
> >>>>> >> >>> ext4_bread
> >>>>> >> >>> +    4.78%     0.04%  glusteriotwr22   [kernel.kallsyms]
> [k]
> >>>>> >> >>> ext4_getblk
> >>>>> >> >>> +    4.72%     0.02%  glusteriotwr22   [kernel.kallsyms]
> [k]
> >>>>> >> >>> __getblk_gfp
> >>>>> >> >>> +    4.57%     0.00%  glusteriotwr3    [unknown]
> [k]
> >>>>> >> >>> 0xffffffffffffffff
> >>>>> >> >>> +    4.55%     0.00%  glusteriotwr3    [kernel.kallsyms]
> [k]
> >>>>> >> >>> do_syscall_64
> >>>>> >> >>>
> >>>>> >> >>> Do you need different or additional information?
> >>>>> >> >>
> >>>>> >> >>
> >>>>> >> >> This looks like there are lot of readdirs going on which is
> >>>>> >> >> different
> >>>>> >> >> from
> >>>>> >> >> what we observed earlier, how many seconds did you do perf
> record
> >>>>> >> >> for?
> >>>>> >> >> Will
> >>>>> >> >> it be possible for you to do this for some more time? may be a
> >>>>> >> >> minute?
> >>>>> >> >> Just
> >>>>> >> >> want to be sure that the data actually represents what we are
> >>>>> >> >> observing.
> >>>>> >> >
> >>>>> >> >
> >>>>> >> > I found one code path which on lookup does readdirs. Could you
> give
> >>>>> >> > me
> >>>>> >> > the
> >>>>> >> > output of ls -l <brick-path>/.glusterfs/indices/xattrop on all
> the
> >>>>> >> > three
> >>>>> >> > bricks? It can probably give a correlation to see if it is
> indeed the
> >>>>> >> > same
> >>>>> >> > issue or not.
> >>>>> >> >
> >>>>> >> >>
> >>>>> >> >>
> >>>>> >> >>>
> >>>>> >> >>>
> >>>>> >> >>>
> >>>>> >> >>> 2018-08-20 11:20 GMT+02:00 Pranith Kumar Karampuri
> >>>>> >> >>> <[email protected]>:
> >>>>> >> >>> > Even the brick which doesn't have high CPU seems to have
> same
> >>>>> >> >>> > number
> >>>>> >> >>> > of
> >>>>> >> >>> > lookups, so that's not it.
> >>>>> >> >>> > Is there any difference at all between the machines which
> have
> >>>>> >> >>> > high
> >>>>> >> >>> > CPU
> >>>>> >> >>> > vs
> >>>>> >> >>> > low CPU?
> >>>>> >> >>> > I think the only other thing I would do is to install perf
> tools
> >>>>> >> >>> > and
> >>>>> >> >>> > try to
> >>>>> >> >>> > figure out the call-graph which is leading to so much CPU
> >>>>> >> >>> >
> >>>>> >> >>> > This affects performance of the brick I think, so you may
> have to
> >>>>> >> >>> > do
> >>>>> >> >>> > it
> >>>>> >> >>> > quickly and for less time.
> >>>>> >> >>> >
> >>>>> >> >>> > perf record --call-graph=dwarf -p   <brick-pid> -o
> >>>>> >> >>> > </path/to/output>
> >>>>> >> >>> > then
> >>>>> >> >>> > perf report -i
> </path/to/output/given/in/the/previous/command>
> >>>>> >> >>> >
> >>>>> >> >>> >
> >>>>> >> >>> > On Mon, Aug 20, 2018 at 2:40 PM Hu Bert <
> [email protected]>
> >>>>> >> >>> > wrote:
> >>>>> >> >>> >>
> >>>>> >> >>> >> gluster volume heal shared info | grep -i number
> >>>>> >> >>> >> Number of entries: 0
> >>>>> >> >>> >> Number of entries: 0
> >>>>> >> >>> >> Number of entries: 0
> >>>>> >> >>> >> Number of entries: 0
> >>>>> >> >>> >> Number of entries: 0
> >>>>> >> >>> >> Number of entries: 0
> >>>>> >> >>> >> Number of entries: 0
> >>>>> >> >>> >> Number of entries: 0
> >>>>> >> >>> >> Number of entries: 0
> >>>>> >> >>> >> Number of entries: 0
> >>>>> >> >>> >> Number of entries: 0
> >>>>> >> >>> >> Number of entries: 0
> >>>>> >> >>> >>
> >>>>> >> >>> >> Looks good to me.
> >>>>> >> >>> >>
> >>>>> >> >>> >>
> >>>>> >> >>> >> 2018-08-20 10:51 GMT+02:00 Pranith Kumar Karampuri
> >>>>> >> >>> >> <[email protected]>:
> >>>>> >> >>> >> > There are a lot of Lookup operations in the system. But
> I am
> >>>>> >> >>> >> > not
> >>>>> >> >>> >> > able to
> >>>>> >> >>> >> > find why. Could you check the output of
> >>>>> >> >>> >> >
> >>>>> >> >>> >> > # gluster volume heal <volname> info | grep -i number
> >>>>> >> >>> >> >
> >>>>> >> >>> >> > it should print all zeros.
> >>>>> >> >>> >> >
> >>>>> >> >>> >> > On Fri, Aug 17, 2018 at 1:49 PM Hu Bert
> >>>>> >> >>> >> > <[email protected]>
> >>>>> >> >>> >> > wrote:
> >>>>> >> >>> >> >>
> >>>>> >> >>> >> >> I don't know what you exactly mean with workload, but
> the
> >>>>> >> >>> >> >> main
> >>>>> >> >>> >> >> function of the volume is storing (incl. writing,
> reading)
> >>>>> >> >>> >> >> images
> >>>>> >> >>> >> >> (from hundreds of bytes up to 30 MBs, overall ~7TB).
> The work
> >>>>> >> >>> >> >> is
> >>>>> >> >>> >> >> done
> >>>>> >> >>> >> >> by apache tomcat servers writing to / reading from the
> >>>>> >> >>> >> >> volume.
> >>>>> >> >>> >> >> Besides
> >>>>> >> >>> >> >> images there are some text files and binaries that are
> stored
> >>>>> >> >>> >> >> on
> >>>>> >> >>> >> >> the
> >>>>> >> >>> >> >> volume and get updated regularly (every x hours); we'll
> try
> >>>>> >> >>> >> >> to
> >>>>> >> >>> >> >> migrate
> >>>>> >> >>> >> >> the latter ones to local storage asap.
> >>>>> >> >>> >> >>
> >>>>> >> >>> >> >> Interestingly it's only one process (and its threads)
> of the
> >>>>> >> >>> >> >> same
> >>>>> >> >>> >> >> brick on 2 of the gluster servers that consumes the CPU.
> >>>>> >> >>> >> >>
> >>>>> >> >>> >> >> gluster11: bricksdd1; not healed; full CPU
> >>>>> >> >>> >> >> gluster12: bricksdd1; got healed; normal CPU
> >>>>> >> >>> >> >> gluster13: bricksdd1; got healed; full CPU
> >>>>> >> >>> >> >>
> >>>>> >> >>> >> >> Besides: performance during heal (e.g. gluster12,
> bricksdd1)
> >>>>> >> >>> >> >> was
> >>>>> >> >>> >> >> way
> >>>>> >> >>> >> >> better than it is now. I've attached 2 pngs showing the
> >>>>> >> >>> >> >> differing
> >>>>> >> >>> >> >> cpu
> >>>>> >> >>> >> >> usage of last week before/after heal.
> >>>>> >> >>> >> >>
> >>>>> >> >>> >> >> 2018-08-17 9:30 GMT+02:00 Pranith Kumar Karampuri
> >>>>> >> >>> >> >> <[email protected]>:
> >>>>> >> >>> >> >> > There seems to be too many lookup operations compared
> to
> >>>>> >> >>> >> >> > any
> >>>>> >> >>> >> >> > other
> >>>>> >> >>> >> >> > operations. What is the workload on the volume?
> >>>>> >> >>> >> >> >
> >>>>> >> >>> >> >> > On Fri, Aug 17, 2018 at 12:47 PM Hu Bert
> >>>>> >> >>> >> >> > <[email protected]>
> >>>>> >> >>> >> >> > wrote:
> >>>>> >> >>> >> >> >>
> >>>>> >> >>> >> >> >> i hope i did get it right.
> >>>>> >> >>> >> >> >>
> >>>>> >> >>> >> >> >> gluster volume profile shared start
> >>>>> >> >>> >> >> >> wait 10 minutes
> >>>>> >> >>> >> >> >> gluster volume profile shared info
> >>>>> >> >>> >> >> >> gluster volume profile shared stop
> >>>>> >> >>> >> >> >>
> >>>>> >> >>> >> >> >> If that's ok, i've attached the output of the info
> >>>>> >> >>> >> >> >> command.
> >>>>> >> >>> >> >> >>
> >>>>> >> >>> >> >> >>
> >>>>> >> >>> >> >> >> 2018-08-17 8:31 GMT+02:00 Pranith Kumar Karampuri
> >>>>> >> >>> >> >> >> <[email protected]>:
> >>>>> >> >>> >> >> >> > Please do volume profile also for around 10
> minutes when
> >>>>> >> >>> >> >> >> > CPU%
> >>>>> >> >>> >> >> >> > is
> >>>>> >> >>> >> >> >> > high.
> >>>>> >> >>> >> >> >> >
> >>>>> >> >>> >> >> >> > On Fri, Aug 17, 2018 at 11:56 AM Pranith Kumar
> Karampuri
> >>>>> >> >>> >> >> >> > <[email protected]> wrote:
> >>>>> >> >>> >> >> >> >>
> >>>>> >> >>> >> >> >> >> As per the output, all io-threads are using a lot
> of
> >>>>> >> >>> >> >> >> >> CPU.
> >>>>> >> >>> >> >> >> >> It
> >>>>> >> >>> >> >> >> >> is
> >>>>> >> >>> >> >> >> >> better
> >>>>> >> >>> >> >> >> >> to
> >>>>> >> >>> >> >> >> >> check what the volume profile is to see what is
> leading
> >>>>> >> >>> >> >> >> >> to
> >>>>> >> >>> >> >> >> >> so
> >>>>> >> >>> >> >> >> >> much
> >>>>> >> >>> >> >> >> >> work
> >>>>> >> >>> >> >> >> >> for
> >>>>> >> >>> >> >> >> >> io-threads. Please follow the documentation at
> >>>>> >> >>> >> >> >> >>
> >>>>> >> >>> >> >> >> >>
> >>>>> >> >>> >> >> >> >>
> >>>>> >> >>> >> >> >> >>
> >>>>> >> >>> >> >> >> >>
> >>>>> >> >>> >> >> >> >>
> >>>>> >> >>> >> >> >> >>
> https://gluster.readthedocs.io/en/latest/Administrator%20Guide/Monitoring%20Workload/
> >>>>> >> >>> >> >> >> >> section: "
> >>>>> >> >>> >> >> >> >>
> >>>>> >> >>> >> >> >> >> Running GlusterFS Volume Profile Command"
> >>>>> >> >>> >> >> >> >>
> >>>>> >> >>> >> >> >> >> and attach output of  "gluster volume profile
> info",
> >>>>> >> >>> >> >> >> >>
> >>>>> >> >>> >> >> >> >> On Fri, Aug 17, 2018 at 11:24 AM Hu Bert
> >>>>> >> >>> >> >> >> >> <[email protected]>
> >>>>> >> >>> >> >> >> >> wrote:
> >>>>> >> >>> >> >> >> >>>
> >>>>> >> >>> >> >> >> >>> Good morning,
> >>>>> >> >>> >> >> >> >>>
> >>>>> >> >>> >> >> >> >>> i ran the command during 100% CPU usage and
> attached
> >>>>> >> >>> >> >> >> >>> the
> >>>>> >> >>> >> >> >> >>> file.
> >>>>> >> >>> >> >> >> >>> Hopefully it helps.
> >>>>> >> >>> >> >> >> >>>
> >>>>> >> >>> >> >> >> >>> 2018-08-17 7:33 GMT+02:00 Pranith Kumar Karampuri
> >>>>> >> >>> >> >> >> >>> <[email protected]>:
> >>>>> >> >>> >> >> >> >>> > Could you do the following on one of the nodes
> where
> >>>>> >> >>> >> >> >> >>> > you
> >>>>> >> >>> >> >> >> >>> > are
> >>>>> >> >>> >> >> >> >>> > observing
> >>>>> >> >>> >> >> >> >>> > high
> >>>>> >> >>> >> >> >> >>> > CPU usage and attach that file to this thread?
> We
> >>>>> >> >>> >> >> >> >>> > can
> >>>>> >> >>> >> >> >> >>> > find
> >>>>> >> >>> >> >> >> >>> > what
> >>>>> >> >>> >> >> >> >>> > threads/processes are leading to high usage.
> Do this
> >>>>> >> >>> >> >> >> >>> > for
> >>>>> >> >>> >> >> >> >>> > say
> >>>>> >> >>> >> >> >> >>> > 10
> >>>>> >> >>> >> >> >> >>> > minutes
> >>>>> >> >>> >> >> >> >>> > when
> >>>>> >> >>> >> >> >> >>> > you see the ~100% CPU.
> >>>>> >> >>> >> >> >> >>> >
> >>>>> >> >>> >> >> >> >>> > top -bHd 5 > /tmp/top.${HOSTNAME}.txt
> >>>>> >> >>> >> >> >> >>> >
> >>>>> >> >>> >> >> >> >>> > On Wed, Aug 15, 2018 at 2:37 PM Hu Bert
> >>>>> >> >>> >> >> >> >>> > <[email protected]>
> >>>>> >> >>> >> >> >> >>> > wrote:
> >>>>> >> >>> >> >> >> >>> >>
> >>>>> >> >>> >> >> >> >>> >> Hello again :-)
> >>>>> >> >>> >> >> >> >>> >>
> >>>>> >> >>> >> >> >> >>> >> The self heal must have finished as there are
> no
> >>>>> >> >>> >> >> >> >>> >> log
> >>>>> >> >>> >> >> >> >>> >> entries
> >>>>> >> >>> >> >> >> >>> >> in
> >>>>> >> >>> >> >> >> >>> >> glustershd.log files anymore. According to
> munin
> >>>>> >> >>> >> >> >> >>> >> disk
> >>>>> >> >>> >> >> >> >>> >> latency
> >>>>> >> >>> >> >> >> >>> >> (average
> >>>>> >> >>> >> >> >> >>> >> io wait) has gone down to 100 ms, and disk
> >>>>> >> >>> >> >> >> >>> >> utilization
> >>>>> >> >>> >> >> >> >>> >> has
> >>>>> >> >>> >> >> >> >>> >> gone
> >>>>> >> >>> >> >> >> >>> >> down
> >>>>> >> >>> >> >> >> >>> >> to ~60% - both on all servers and hard disks.
> >>>>> >> >>> >> >> >> >>> >>
> >>>>> >> >>> >> >> >> >>> >> But now system load on 2 servers (which were
> in the
> >>>>> >> >>> >> >> >> >>> >> good
> >>>>> >> >>> >> >> >> >>> >> state)
> >>>>> >> >>> >> >> >> >>> >> fluctuates between 60 and 100; the server
> with the
> >>>>> >> >>> >> >> >> >>> >> formerly
> >>>>> >> >>> >> >> >> >>> >> failed
> >>>>> >> >>> >> >> >> >>> >> disk has a load of 20-30.I've uploaded some
> munin
> >>>>> >> >>> >> >> >> >>> >> graphics of
> >>>>> >> >>> >> >> >> >>> >> the
> >>>>> >> >>> >> >> >> >>> >> cpu
> >>>>> >> >>> >> >> >> >>> >> usage:
> >>>>> >> >>> >> >> >> >>> >>
> >>>>> >> >>> >> >> >> >>> >> https://abload.de/img/gluster11_cpu31d3a.png
> >>>>> >> >>> >> >> >> >>> >> https://abload.de/img/gluster12_cpu8sem7.png
> >>>>> >> >>> >> >> >> >>> >> https://abload.de/img/gluster13_cpud7eni.png
> >>>>> >> >>> >> >> >> >>> >>
> >>>>> >> >>> >> >> >> >>> >> This can't be normal. 2 of the servers under
> heavy
> >>>>> >> >>> >> >> >> >>> >> load
> >>>>> >> >>> >> >> >> >>> >> and
> >>>>> >> >>> >> >> >> >>> >> one
> >>>>> >> >>> >> >> >> >>> >> not
> >>>>> >> >>> >> >> >> >>> >> that much. Does anyone have an explanation of
> this
> >>>>> >> >>> >> >> >> >>> >> strange
> >>>>> >> >>> >> >> >> >>> >> behaviour?
> >>>>> >> >>> >> >> >> >>> >>
> >>>>> >> >>> >> >> >> >>> >>
> >>>>> >> >>> >> >> >> >>> >> Thx :-)
> >>>>> >> >>> >> >> >> >>> >>
> >>>>> >> >>> >> >> >> >>> >> 2018-08-14 9:37 GMT+02:00 Hu Bert
> >>>>> >> >>> >> >> >> >>> >> <[email protected]>:
> >>>>> >> >>> >> >> >> >>> >> > Hi there,
> >>>>> >> >>> >> >> >> >>> >> >
> >>>>> >> >>> >> >> >> >>> >> > well, it seems the heal has finally
> finished.
> >>>>> >> >>> >> >> >> >>> >> > Couldn't
> >>>>> >> >>> >> >> >> >>> >> > see/find
> >>>>> >> >>> >> >> >> >>> >> > any
> >>>>> >> >>> >> >> >> >>> >> > related log message; is there such a
> message in a
> >>>>> >> >>> >> >> >> >>> >> > specific
> >>>>> >> >>> >> >> >> >>> >> > log
> >>>>> >> >>> >> >> >> >>> >> > file?
> >>>>> >> >>> >> >> >> >>> >> >
> >>>>> >> >>> >> >> >> >>> >> > But i see the same behaviour when the last
> heal
> >>>>> >> >>> >> >> >> >>> >> > finished:
> >>>>> >> >>> >> >> >> >>> >> > all
> >>>>> >> >>> >> >> >> >>> >> > CPU
> >>>>> >> >>> >> >> >> >>> >> > cores are consumed by brick processes; not
> only
> >>>>> >> >>> >> >> >> >>> >> > by
> >>>>> >> >>> >> >> >> >>> >> > the
> >>>>> >> >>> >> >> >> >>> >> > formerly
> >>>>> >> >>> >> >> >> >>> >> > failed
> >>>>> >> >>> >> >> >> >>> >> > bricksdd1, but by all 4 brick processes (and
> >>>>> >> >>> >> >> >> >>> >> > their
> >>>>> >> >>> >> >> >> >>> >> > threads).
> >>>>> >> >>> >> >> >> >>> >> > Load
> >>>>> >> >>> >> >> >> >>> >> > goes
> >>>>> >> >>> >> >> >> >>> >> > up to > 100 on the 2 servers with the
> not-failed
> >>>>> >> >>> >> >> >> >>> >> > brick,
> >>>>> >> >>> >> >> >> >>> >> > and
> >>>>> >> >>> >> >> >> >>> >> > glustershd.log gets filled with a lot of
> entries.
> >>>>> >> >>> >> >> >> >>> >> > Load
> >>>>> >> >>> >> >> >> >>> >> > on
> >>>>> >> >>> >> >> >> >>> >> > the
> >>>>> >> >>> >> >> >> >>> >> > server
> >>>>> >> >>> >> >> >> >>> >> > with the then failed brick not that high,
> but
> >>>>> >> >>> >> >> >> >>> >> > still
> >>>>> >> >>> >> >> >> >>> >> > ~60.
> >>>>> >> >>> >> >> >> >>> >> >
> >>>>> >> >>> >> >> >> >>> >> > Is this behaviour normal? Is there some
> post-heal
> >>>>> >> >>> >> >> >> >>> >> > after
> >>>>> >> >>> >> >> >> >>> >> > a
> >>>>> >> >>> >> >> >> >>> >> > heal
> >>>>> >> >>> >> >> >> >>> >> > has
> >>>>> >> >>> >> >> >> >>> >> > finished?
> >>>>> >> >>> >> >> >> >>> >> >
> >>>>> >> >>> >> >> >> >>> >> > thx in advance :-)
> >>>>> >> >>> >> >> >> >>> >
> >>>>> >> >>> >> >> >> >>> >
> >>>>> >> >>> >> >> >> >>> >
> >>>>> >> >>> >> >> >> >>> > --
> >>>>> >> >>> >> >> >> >>> > Pranith
> >>>>> >> >>> >> >> >> >>
> >>>>> >> >>> >> >> >> >>
> >>>>> >> >>> >> >> >> >>
> >>>>> >> >>> >> >> >> >> --
> >>>>> >> >>> >> >> >> >> Pranith
> >>>>> >> >>> >> >> >> >
> >>>>> >> >>> >> >> >> >
> >>>>> >> >>> >> >> >> >
> >>>>> >> >>> >> >> >> > --
> >>>>> >> >>> >> >> >> > Pranith
> >>>>> >> >>> >> >> >
> >>>>> >> >>> >> >> >
> >>>>> >> >>> >> >> >
> >>>>> >> >>> >> >> > --
> >>>>> >> >>> >> >> > Pranith
> >>>>> >> >>> >> >
> >>>>> >> >>> >> >
> >>>>> >> >>> >> >
> >>>>> >> >>> >> > --
> >>>>> >> >>> >> > Pranith
> >>>>> >> >>> >
> >>>>> >> >>> >
> >>>>> >> >>> >
> >>>>> >> >>> > --
> >>>>> >> >>> > Pranith
> >>>>> >> >>
> >>>>> >> >>
> >>>>> >> >>
> >>>>> >> >> --
> >>>>> >> >> Pranith
> >>>>> >> >
> >>>>> >> >
> >>>>> >> >
> >>>>> >> > --
> >>>>> >> > Pranith
> >>>>> >
> >>>>> >
> >>>>> >
> >>>>> > --
> >>>>> > Pranith
> >>>>
> >>>>
> >>>>
> >>>> --
> >>>> Pranith
>


--
Pranith
_______________________________________________
Gluster-users mailing list
[email protected]
https://lists.gluster.org/mailman/listinfo/gluster-users