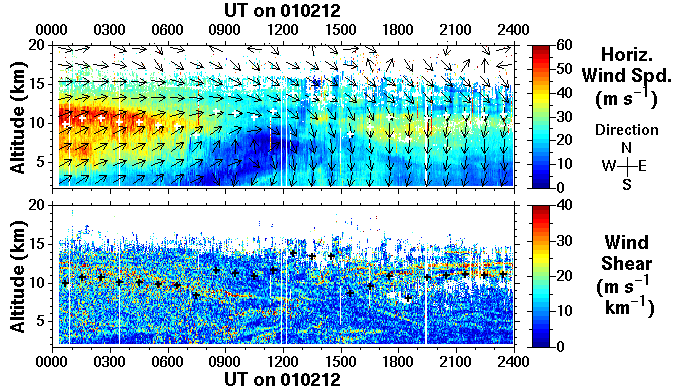
I am new to Google Chart and I love it.
A few things items that I am not able to achieve. I am not sure about
item 1 but item 2 and 3 are currently not available in Google Chart.
Can someone who has more experience chime in?
1. Creating a time-series for a data data set (real numbers) above
100.
2. Creating vector plot (e.g. wind vector or flow vector)
Link to show the example of time-height wind vector plot:
http://mst.nerc.ac.uk/FIGS/010212_hw.png
3. Creating wind barb. This is very simlar to vector plot and an
example is available at:
http://www.cnrm.meteo.fr/aladin-old/newsletters/news21/ALADIN_Deported.gif
(bottom panel of the graph).
--~--~---------~--~----~------------~-------~--~----~
You received this message because you are subscribed to the Google Groups
"Google Chart API" group.
To post to this group, send email to [email protected]
To unsubscribe from this group, send email to
[email protected]
For more options, visit this group at
http://groups.google.com/group/google-chart-api?hl=en
-~----------~----~----~----~------~----~------~--~---