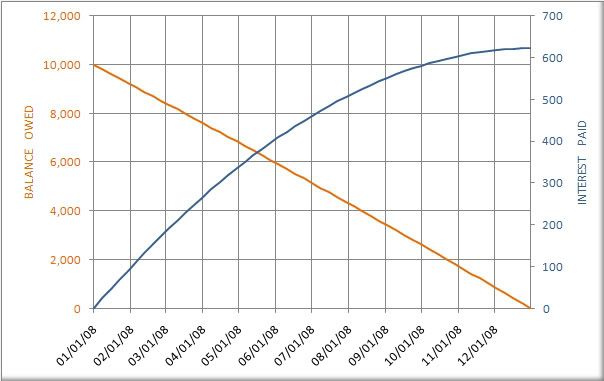
I'm new to Google visualizations and I am reading through the
documentation, but I'm trying to create a chart with 2 separate Y
axes.
For an example, see here:
http://i214.photobucket.com/albums/cc87/neilmbrewer/DualY.jpg

Is this possible with the Google Chart API?
I'll keep looking, but someone with more experience may be able to put
me on the right path pretty quickly.

Thanks a bunch,
NB
--~--~---------~--~----~------------~-------~--~----~
You received this message because you are subscribed to the Google Groups
"Google Visualization API" group.
To post to this group, send email to [email protected]
To unsubscribe from this group, send email to
[email protected]
For more options, visit this group at
http://groups.google.com/group/google-visualization-api?hl=en
-~----------~----~----~----~------~----~------~--~---