Ok I found the problem,

I changed
data.addColumn('date', 'Date');
into
data.addColumn('datetime', 'Date');
On Dec 4, 5:17 pm, acemtp <[email protected]> wrote:
> Hello,
>
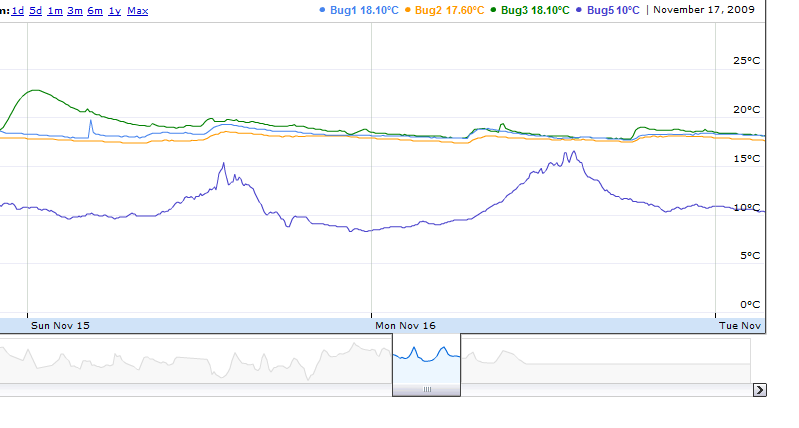
> I'm using an annotatedtimeline to display some graphs. I have about
> 500 values per day and i have the date+time.
>
> The graph is displaying well as you can see here:
>
> http://clip2net.com/clip/m9195/1259943292-clip-24kb.png
>
> But I cannot zoom more to see some detail of the graph.
>
> I would like to be able to zoom more and display the hour / minutes in
> the X scale but I don't find how.
--
You received this message because you are subscribed to the Google Groups
"Google Visualization API" group.
To post to this group, send email to [email protected].
To unsubscribe from this group, send email to
[email protected].
For more options, visit this group at
http://groups.google.com/group/google-visualization-api?hl=en.