If you post the full code, I can take a look and see what might be wrong,
but given your desire to use a non-date type axis, you are probably better
off switching to a LineChart with a ChartRangeFilter.  With those, you can
enter your times as type "number" or "timeofday" as appropriate.
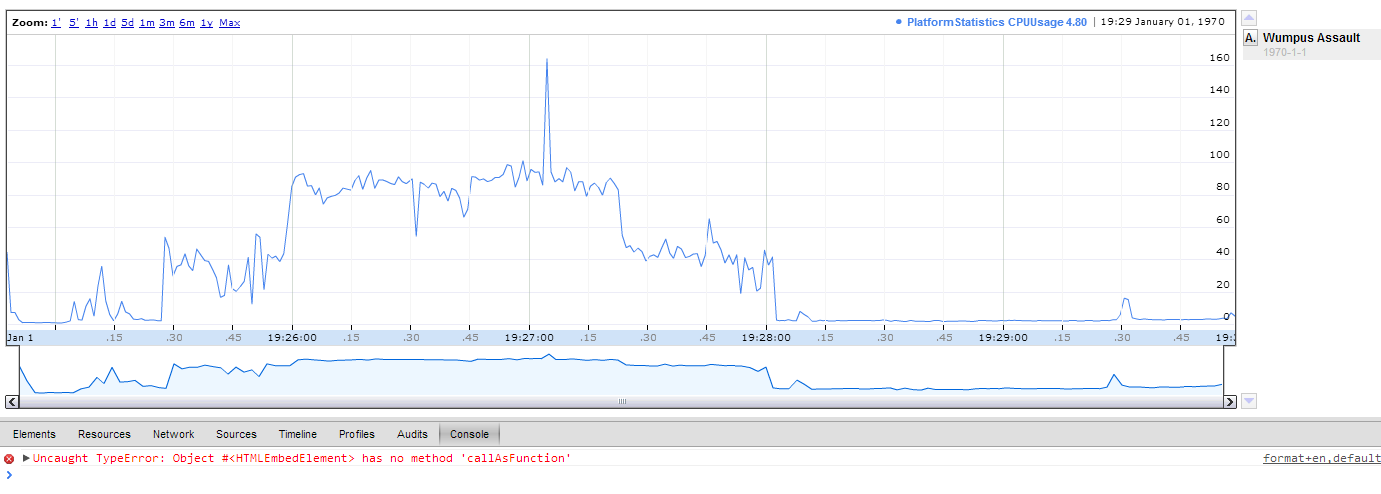
On Tuesday, July 2, 2013 11:49:43 AM UTC-4, Log Reader wrote:
>
> Also, if possible is there a way to make this only use times, and not
> dates? All of my time values are stored as time stamps after the start of
> the program, I.E. 29 minutes 12 second 30 ms, which when converted into
> milliseconds and used to instantiate a java date object, comes out to some
> time on January 1. Is it possible to change this to just be a time instead
> of also having a date component?
>
> On Tuesday, July 2, 2013 2:58:35 PM UTC+2, Log Reader wrote:
>>
>>
>> <https://lh3.googleusercontent.com/-v_ma5HXwtbA/UdLMbma-u3I/AAAAAAAAAAo/kWZyjyRLNAo/s1381/annotationError.png>
>>
>> This picture shows it all. The annotation appears in the list, but it is
>> not on the chart. When I click it, I get the following error: "Uncaught
>> TypeError: Object #<HTMLEbedElement> has no method 'callAsFunction' "
>> I build the data table procedurally. So I have the following calls:
>>
>> data.addColumn(timestamp);
>> data.addColumn(CPUUsage);
>> data.addColumn({type: 'string', role: 'annotation'}); // I have also
>> tried "data.addColumn('string', 'title1');" to no avail, the same behavior
>> happens
>> for the data.addRow call I have two possibilities:
>> if the timestamp to be added matches the wumpus attack time stamp:
>> data.addRow([ ### (the timestamp in miliseconds), CPUUsage, 'wumpus attack')
>> if not: data.addRow(data.addRow([ ### (the timestamp in miliseconds),
>> CPUUsage, '') // I have also tried passing null for the third argument,
>> same behavior
>>
>> I'm not sure what I'm doing wrong. Can anyone shed some light on whats
>> going on here?
>>
>>
>>

--
You received this message because you are subscribed to the Google Groups
"Google Visualization API" group.
To unsubscribe from this group and stop receiving emails from it, send an email
to [email protected].
To post to this group, send email to [email protected].
Visit this group at http://groups.google.com/group/google-visualization-api.
For more options, visit https://groups.google.com/groups/opt_out.