The first part, where the colors weren't matching, was due to a timing
issue: the "statechange" event was being fire before the new data was
passed to the chart, so the call to chart.getDataTable was returning the
old data, and thus the colors were not based on the correct data.  To fix
that, you need to implement a double level event handler, where the
"statechange" event handler registers a "ready" event handler for the chart
that updates the chart's colors:
function updateChartColors () {
var afterChange = google.visualization.events.addListener(chart,
'ready', function () {
google.visualization.events.removeListener(afterChange);
var dt = chart.getDataTable();
console.log(getColors(dt));
chart.setOption('colors', getColors(dt));
chart.draw();
});
}
google.visualization.events.addListener(control, 'statechange',
updateChartColors);
google.visualization.events.addListener(mallasPicker, 'statechange',
updateChartColors);
google.visualization.events.addListener(procesosPicker, 'statechange',
updateChartColors);
see jsfiddle example: http://jsfiddle.net/asgallant/5hN5V/5/
The second error is caused by the filters returning zero rows of data. I'm
not aware of any way to work around the problem.
On Monday, November 4, 2013 7:18:55 AM UTC-5, letyqueta wrote:
>
> There are two things to correct in the code [http://jsfiddle.net/5hN5V/1/
> ],
>
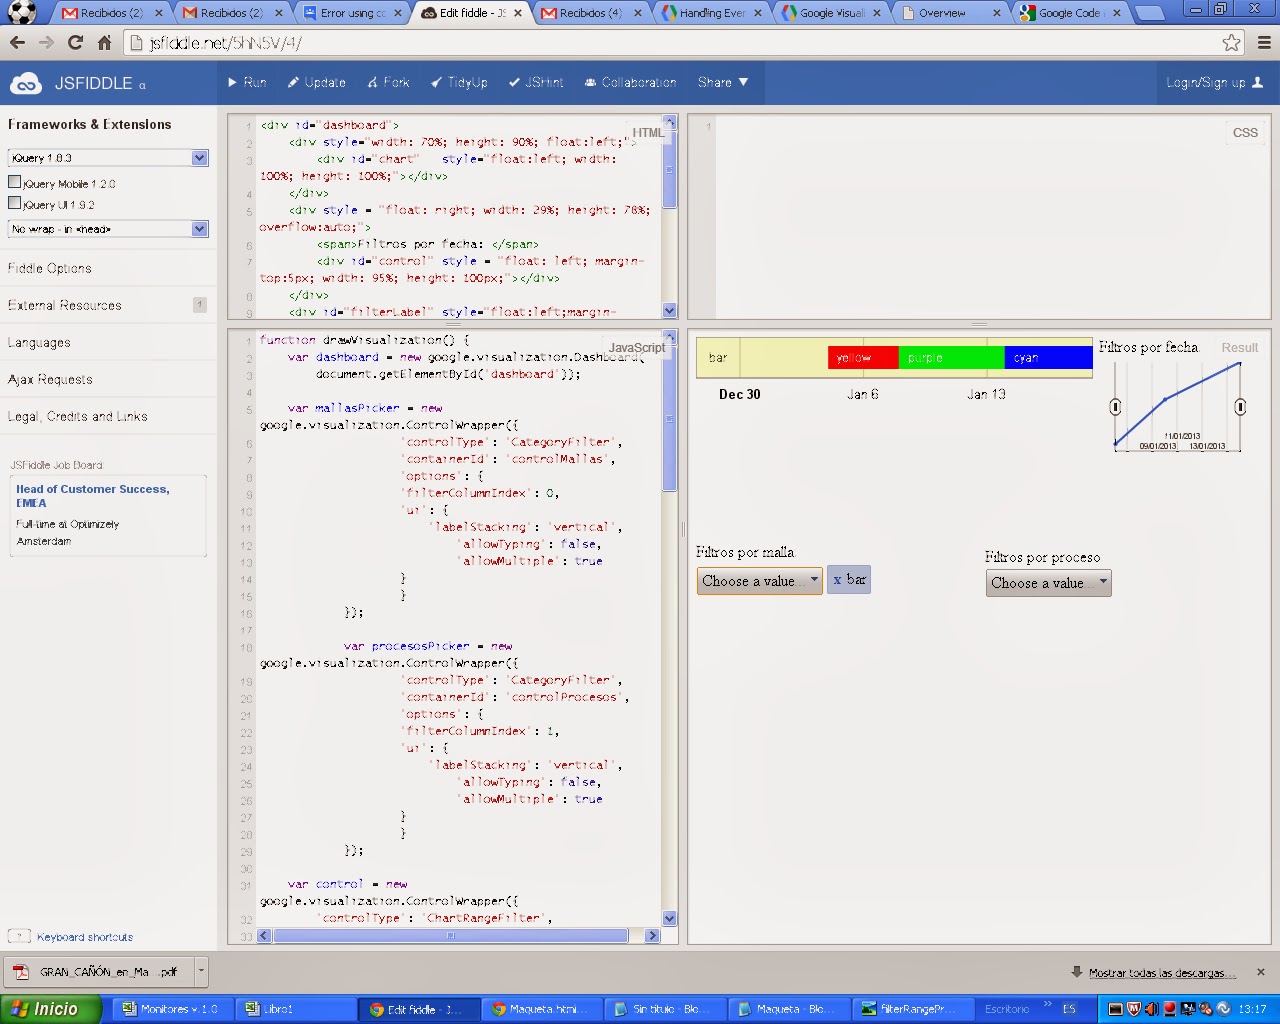
> 1) select event in the category filters (mallasPicker and procesosPicker)
> doesn't change colors after filtering but it does if you delete the
> selection from the list
>
>
> <https://lh4.googleusercontent.com/-MriPs5bPBjs/UneQZHnIapI/AAAAAAAARH8/VaH7yOqw5B0/s1600/colorsProblem.bmp>
>
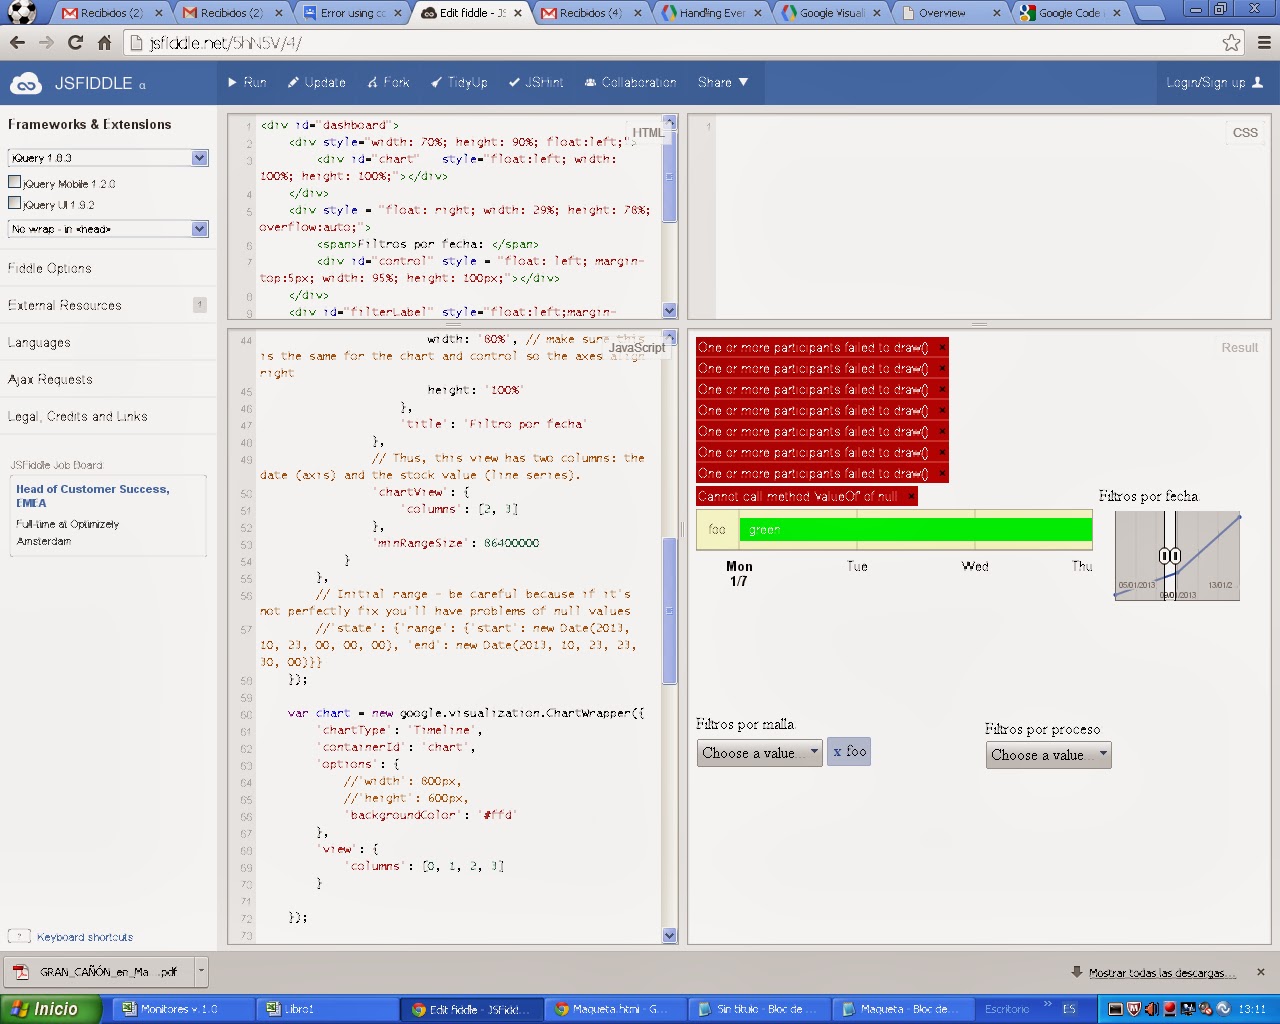
> 2) if select using the dates range filter as in the attached image:
>
>
> <https://lh6.googleusercontent.com/-1_GVjiXQT04/UneP4f2xUpI/AAAAAAAARHw/fuR2O11_Obg/s1600/filterRangeProblem.bmp>
>
> when having just one element in the main graphic (pre-filtered using the
> category filter), then there is an exception trying to paint the result.
>
> Any idea? thank you very much for your help!
>
> El lunes, 4 de noviembre de 2013 11:27:26 UTC+1, letyqueta escribió:
>>
>> Good morning,
>>
>> I've been working on your code here: http://jsfiddle.net/5hN5V/1/
>> and If tryied to add new controls that uses your dinamic function to
>> update the colors.
>> I don't know why, but it seems not to work using a category filter as
>> well.
>> Can you take a look?
>>
>> Thank you for your answers!
>>
>> El jueves, 31 de octubre de 2013 11:28:44 UTC+1, letyqueta escribió:
>>>
>>> I'm using a timeline and a changeRangeFilter to filter by date over the
>>> x-axis timeline chart.
>>>
>>> I need to use the colors array because the color depends of status and
>>> this field is not present in the main chart so I need to specify the color
>>> as you can see in the code.
>>> At filtering time, It filter correctly the dates range, but it also
>>> change the bars colors because it associates the color to the position in
>>> the array.
>>>
>>> How can I mantain for each bar the color asigned in the color's array
>>> after the filtering action?
>>>
>>> Thank you very much!!!
>>>
>>>
>>>
--
You received this message because you are subscribed to the Google Groups
"Google Visualization API" group.
To unsubscribe from this group and stop receiving emails from it, send an email
to [email protected].
To post to this group, send email to [email protected].
Visit this group at http://groups.google.com/group/google-visualization-api.
For more options, visit https://groups.google.com/groups/opt_out.