<https://lh4.googleusercontent.com/-wAcgAdSwIiU/UpT4Dbu2VbI/AAAAAAAAAAM/2F2jX881p5M/s1600/Untitled.jpg>
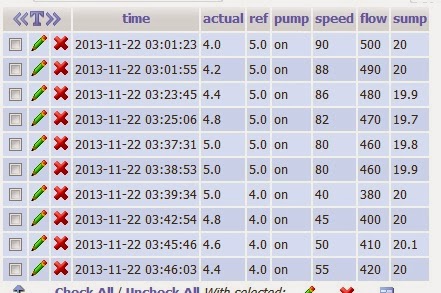
I want to get data from mysql database and make an Annotated Time Line
graph. I attached a view of my database above. I used 2 pages, one for get
data from database and other for drawing chart.
Following is the page get the data from database.
<?php

mysql_connect('host','user,'pw');
mysql_select_db('DB');

$sqlquery1="SELECT * FROM TABLE";

$sqlresult1=mysql_query($sqlquery1);
$rows = mysql_num_rows($sqlresult1);
$output=array();
$table['cols']=array(
        array('label'=> 'date', type=>'datetime'),
        array('label'=>'actual', type=>'number')
);

while($rows>0){
            $row = mysql_fetch_row($sqlresult1);
                $output['rows'][] = array("{$row[0]}", $row[1]);
                $rows--;
}


echo json_encode($output);
?>

Output is like this.
<https://lh3.googleusercontent.com/-ZMCAK4wfxvo/UpT5Kosod1I/AAAAAAAAAAY/QPuqBXgNNkU/s1600/Untitled1.jpg>

Page 2 which will draw the chart code is bellow.

<html>
<head>
    <title>My realtime chart</title>
    <script type="text/javascript"
src="https://www.google.com/jsapi";></script>
        <script type="text/javascript"
src="http://ajax.googleapis.com/ajax/libs/jquery/1.8.2/jquery.min.js";></script>
        <script type="text/javascript">
      google.load('visualization', '1', {'packages':['annotatedtimeline']});
      google.setOnLoadCallback(drawChart);
      function drawChart() {

        // Create the data table.
        var jsonData = $.ajax({
        url:'json.php',
        dataType:'json',
        async:false
        }).responseText;

        var data=new google.visualization.DataTable(jsonData);
        //var view=new google.visualization.DataView(data);
        // Set chart options
        var options = {'title':'Water level change',
                       'width':600  ,
                       'height':550};

        // Instantiate and draw our chart, passing in some options.
        var chart = new
google.visualization.LineChart(document.getElementById('chart_product_history'));
        chart.draw(data, options);
      }
    </script>
</head>
<body>
<div id='chart_product_history' style="width: 500px; height: 500px;"></div>
</body>
</html>

But nothing displays.
I am a beginner in coding and please help.
Thanks

--
You received this message because you are subscribed to the Google Groups
"Google Visualization API" group.
To unsubscribe from this group and stop receiving emails from it, send an email
to [email protected].
To post to this group, send email to [email protected].
Visit this group at http://groups.google.com/group/google-visualization-api.
For more options, visit https://groups.google.com/groups/opt_out.