I meet the same ERROR in
https://code.google.com/apis/ajax/playground/?type=visualization&hl=zh-CN#annotated_time_line,

when copy the html and load it in chrome.
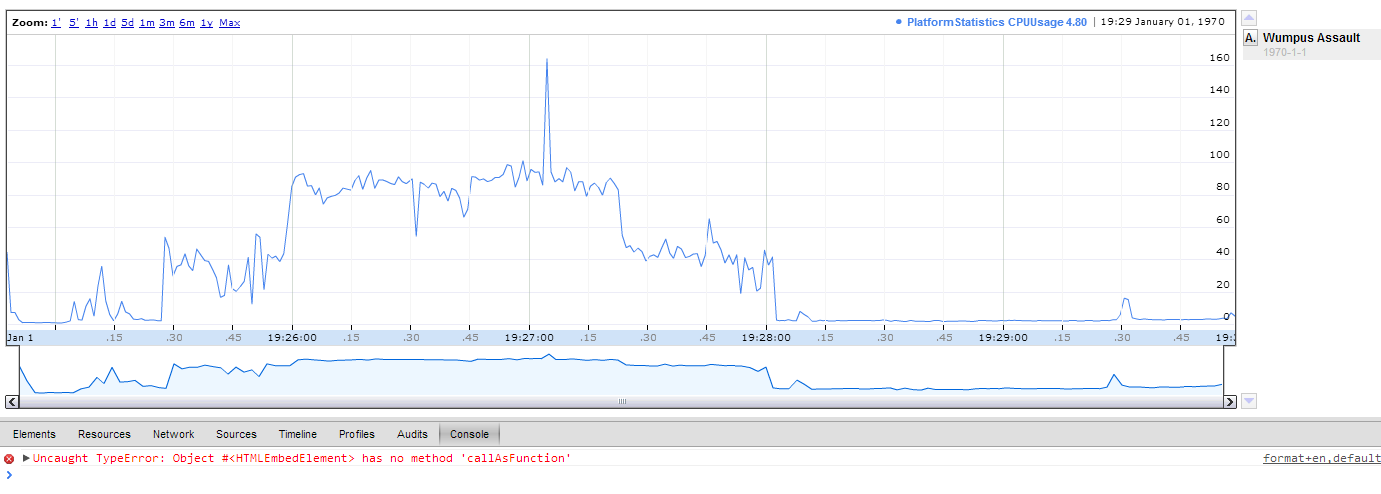
On Tuesday, July 2, 2013 8:58:35 PM UTC+8, Log Reader wrote:
>
>
> <https://lh3.googleusercontent.com/-v_ma5HXwtbA/UdLMbma-u3I/AAAAAAAAAAo/kWZyjyRLNAo/s1381/annotationError.png>
>
> This picture shows it all. The annotation appears in the list, but it is
> not on the chart. When I click it, I get the following error: "Uncaught
> TypeError: Object #<HTMLEbedElement> has no method 'callAsFunction' "
> I build the data table procedurally. So I have the following calls:
>
> data.addColumn(timestamp);
> data.addColumn(CPUUsage);
> data.addColumn({type: 'string', role: 'annotation'}); // I have also tried
> "data.addColumn('string', 'title1');" to no avail, the same behavior happens
> for the data.addRow call I have two possibilities:
> if the timestamp to be added matches the wumpus attack time stamp:
> data.addRow([ ### (the timestamp in miliseconds), CPUUsage, 'wumpus attack')
> if not: data.addRow(data.addRow([ ### (the timestamp in miliseconds),
> CPUUsage, '') // I have also tried passing null for the third argument,
> same behavior
>
> I'm not sure what I'm doing wrong. Can anyone shed some light on whats
> going on here?
>
>
>

--
You received this message because you are subscribed to the Google Groups
"Google Visualization API" group.
To unsubscribe from this group and stop receiving emails from it, send an email
to [email protected].
To post to this group, send email to [email protected].
Visit this group at http://groups.google.com/group/google-visualization-api.
For more options, visit https://groups.google.com/d/optout.