Hello,

I apologise in advance for my lack of knowledge. I am using both Firefox
and Safari running on OS10.9.5
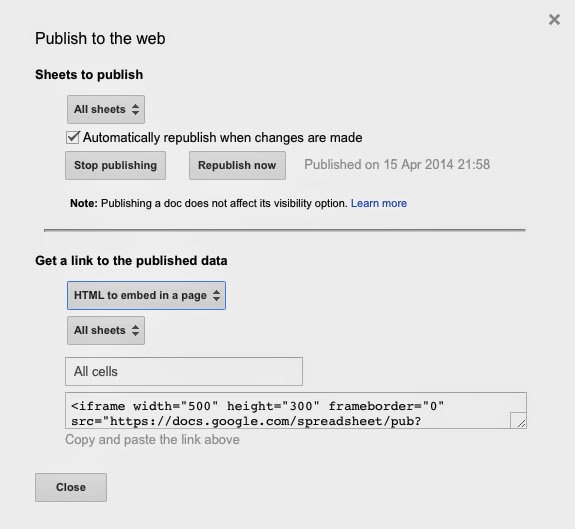
I have previously used motion-charts embedded in to webpages, this was prior to them being deprecated [Gadgets] That was an easier time for beginners. I had some problems with setting initial-states of the new "charts" and was part of this thread: https://groups.google.com/forum/?fromgroups=#!topic/google-visualization-api/2auRYCxk_jo I was able to successfully add charts to my Wordpress sites. They are still running correctly. The older code I have is: <script type="text/javascript" src= "//ajax.googleapis.com/ajax/static/modules/gviz/1.0/chart.js"> { "dataSourceUrl": "//docs.google.com/spreadsheet/tq?key=0Am_AcfeQZNjCdEJpWlAtWjhWeHM0cm00MVNwQzZqckE&transpose=0&headers=1&range=A1%3AH321&gid=0&pub=1" ,"options":{"titleTextStyle":{"fontSize":16},"vAxes":[{"useFormatFromData": true,"title":"Left vertical axis title","minValue":null,"viewWindow":{"min": null,"max":null},"maxValue":null},{"useFormatFromData":true,"minValue":null, "viewWindow":{"min":null,"max":null},"maxValue":null}],"booleanRole": "certainty","title":"Chart title","hAxis":{"useFormatFromData":true,"title":"Horizontal axis title","minValue":null,"viewWindow":{"min":null,"max":null},"maxValue": null},"width":800,"height":700,"animation":{"duration":0},"state": '{"yZoomedDataMin":42.1,"yLambda":1,"orderedByX":false,"colorOption":"2","yZoomedDataMax":88.5,"xZoomedDataMin":27.2,"sizeOption":"4","xAxisOption":"6","iconKeySettings":[],"dimensions":{"iconDimensions":["dim0"]},"time":"2003","yAxisOption":"3","iconType":"BUBBLE","uniColorForNonSelected":false,"orderedByY":false,"xZoomedIn":false,"nonSelectedAlpha":0.4,"duration":{"multiplier":1,"timeUnit":"Y"},"playDuration":15000,"xLambda":1,"yZoomedIn":false,"xZoomedDataMax":94.4,"showTrails":true}' },"view":{"columns":[0,1,{"label":"Urban/Rural","properties":{"role": "annotation"},"sourceColumn":2},3,4,{"label":"Region","properties":{"role": "annotation"},"sourceColumn":5},6,7]},"isDefaultVisualization":true, "chartType":"MotionChart","chartName":"Chart1"} </script> This displays as I expect, like this: <https://lh3.googleusercontent.com/-tiB8NB9-0es/VDZ1sIHYL4I/AAAAAAAAAIM/u8ZuCdjb2q8/s1600/MotionChart1.jpg> I now find that when trying to use Google Drive/Sheets to update/generate a Motion Chart, I cannot get the motion chart to *approximate anything like I currently have on my site*, with the older code? If I PUBLISH TO THE WEB, I get *iFrame code* that only produces this: The chart is compressed an unreadable? <https://lh4.googleusercontent.com/-uRqcbZs5knA/VDZ4EJdpBfI/AAAAAAAAAIg/CEeBKoE6hRY/s1600/iFrame-Nochanges.jpg> I have worked out that if I add Height and Width dimensions to the *iFrame code, *it improves things a little: <iframe width="600" height="500" frameborder="0" src= "https://docs.google.com/spreadsheets/d/1Iu3bY0zFIvrq3qMxqzfx4ybcOhOXLJ_C8H_3bcDKY3Q/pubhtml?gid=2034544636&single=true&widget=true&headers=false"; ></iframe> I still cannot set an initial state and nor does the chart display properly. <https://lh4.googleusercontent.com/-05x6JbPgNhg/VDZ2oFwVCwI/AAAAAAAAAIU/DZqxC_9YeKw/s1600/IFrameCode-New.jpg> I am also confused about the differences I see between OPTIONS I am presented with when trying to *publish* different sheets/charts to the web. I have an older motion chart with *OECD Data* that is still displaying correctly. When I go to this sheet/chart on Google Drive and select "Publish to Web" from the file menu, I see these options: <https://lh4.googleusercontent.com/-FYfMsqEHrns/VDZ7InAL-qI/AAAAAAAAAIs/E44Qpg6TWKI/s1600/HTML-to_embed.jpg> It gives me an option that says: "HTML to embed in a page" This is where I saw the width and height option. If I try to publish my newer/updated sheet/chart, I don't see the same options, I see this and am confused: <https://lh4.googleusercontent.com/-jQ9WM3mmYjw/VDZ97m4HWiI/AAAAAAAAAJA/4LVqT2EU6S0/s1600/Different_Options.jpg> When I use this code, I get a chart but it is still not like the earlier chart and shows formatting and space issues? I have added some dimensions but that is the extent of my understanding. <iframe width="600" height="900" frameborder="0" src= "https://docs.google.com/spreadsheet/pub?key=0Am_AcfeQZNjCdDlhX3hEaU9lTjFRT3c4YVY1eDlCSXc&single=true&gid=5&output=html&widget=true"; ></iframe> <https://lh3.googleusercontent.com/-99KXb00Zq2s/VDZ7_D5o1EI/AAAAAAAAAI0/tGwkhZdDvhc/s1600/OECD_Data.jpg> *Request* Can anyone provide some guidance/advice/trouble shooting tips to help me work my way through this problem? - I have existing/older charts that still function, but I don't want to touch them because I fear I will not be able to reproduce what I have. - The newer charts only provide a snippet of "iframe" code and it is not clear how to edit/adjust that to set a starting state or properly control the dimensions of the chart on the page. Any constructive advice will be appreciated. Kind regards Cet. -- You received this message because you are subscribed to the Google Groups "Google Visualization API" group. To unsubscribe from this group and stop receiving emails from it, send an email to [email protected]. To post to this group, send email to [email protected]. Visit this group at http://groups.google.com/group/google-visualization-api. For more options, visit https://groups.google.com/d/optout.