Dear All,

Kindly need your help....
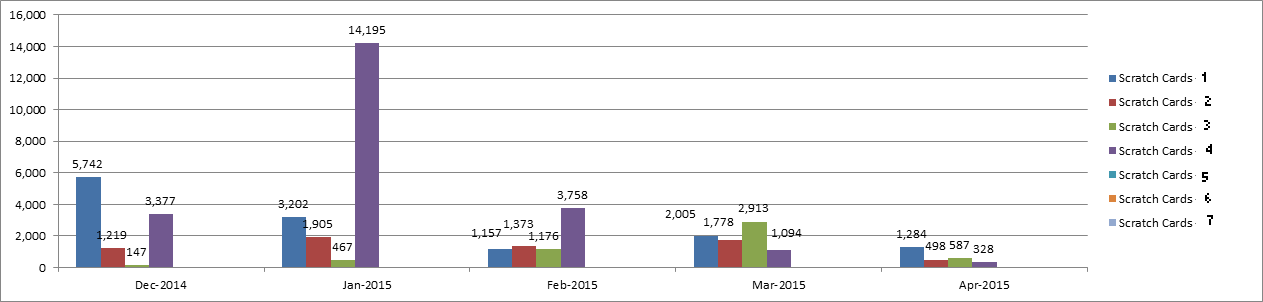
I've seen the hack that "*asgallant"* made for *combochart *in file
*"checkOrignal.html"*

what I'm trying to achieve is in picture *"barchart.png", *this been made
in excel but I need to make a webpage instead of it..

<https://lh3.googleusercontent.com/-fA8ncBdUWzU/VTYpdkROVWI/AAAAAAAAAIA/92rdl0wYjSY/s1600/barChart.png>
Retrieve *3 columns* from mysql database..

*count(serials)* *y-axis* , *sold-date* *x-axis* but it will group by
*item-desc* and for every item showing a different color and showing them
on the right hand side ! and there will be a label on the top of every
column or bar .... please help me

Please Help !!

Thanks in advance,
Hisham

--
You received this message because you are subscribed to the Google Groups
"Google Visualization API" group.
To unsubscribe from this group and stop receiving emails from it, send an email
to [email protected].
To post to this group, send email to [email protected].
Visit this group at http://groups.google.com/group/google-visualization-api.
For more options, visit https://groups.google.com/d/optout.