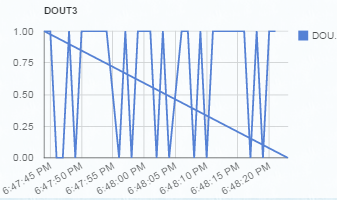
Hi,

<https://lh3.googleusercontent.com/-2aOBDoMkv5Q/VT5bxGeCkcI/AAAAAAAAAG0/xJvOvqzD7sI/s1600/lineChart.PNG>
I'm retrieving data from a logger in real time and display it on web
browser. Sometime the line chart behaves weirdly. As you can see from the
image. There is a line crossing the whole chart but it is connected to the
first sample. I cant find the reason. Any suggestion is more then welcome.
Faysal,

--
You received this message because you are subscribed to the Google Groups
"Google Visualization API" group.
To unsubscribe from this group and stop receiving emails from it, send an email
to [email protected].
To post to this group, send email to [email protected].
Visit this group at http://groups.google.com/group/google-visualization-api.
For more options, visit https://groups.google.com/d/optout.