      It is practically impossible to imagine any dashboard without graphs
and charts. They present complex statistics quickly and effectively.
Additionally, a good chart also enhances the overall design of our website.
In this article, I will show you 3 best JavaScript chart
libraries——Fusioncharts, VanCharts and Highcharts.These Javascript charts
<http://www.vancharts.com/> will help us create beautiful and customizable
charts for our projects. This article will compare 3 best JavaScript charts
libraries.Summary
Fusioncharts is delightful JavaScript charts for web and mobile
applications. VanCharts is JavaScript Charts library for Web, Mobile &
Apps. Highcharts is Interactive JavaScript charts for your web projects.
<https://lh3.googleusercontent.com/-rJuJV73Q2G4/VUGXRso0SJI/AAAAAAAAACQ/5v7OTShchjA/s1600/01.png>
Charts rendered in
Fusioncharts use SVG and VML to render charts. VanCharts use canvas
and VML. Highcharts are rendered using SVG and VML.
Data
Fusioncharts provides data parsing through both JSON and XML.
VanCharts provides data parsing through JSON
<http://www.vancharts.com/JSON-data-set.html>, Excel
<http://www.vancharts.com/Local-excel.html> and built-in dataset
<http://www.vancharts.com/built-in-data-set.html>. Highcharts provides data
parsing through only JSON.
Browser
Fusioncharts VanCharts and Highcharts are all highly compatible with
older browsers like Internet Explorer 6. They support almost all other
browsers.
Chart types
These 3 JavaScript charts libraries provide all the major chart types
like pie, column, bar, area, geo, timeline, and multiple series.
Fusioncharts provides 30+ chart types. VanCharts provides 25+ charts and
maps in both 2D and 3D. Highcharts provides 25+ chart types.
<https://lh3.googleusercontent.com/-OUn9uLMJ9-M/VUGYcC7FKAI/AAAAAAAAACY/reNmbog4GxE/s1600/02.png>
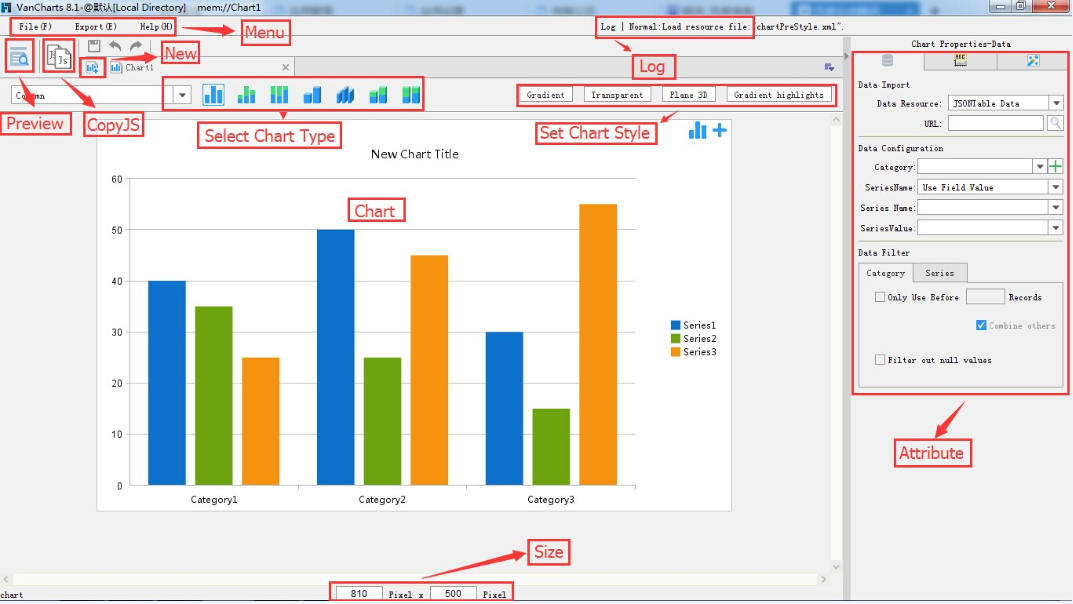
Chart Maker
VanCharts JS chart maker <http://www.vancharts.com/usage-guide.html> is
a offline tool aimed at reducing code amount and enhancing work efficiency
for its user. Via this chart maker, user can save and preview chart design
files with file extension .crt in local storage and may also export them as
JavaScript to insert into Web pages. Highcharts has a online maker.
Fusioncharts doesn’t have one.
<https://lh3.googleusercontent.com/--v2QMXdj3F4/VUGYuVF7SPI/AAAAAAAAACg/dCxnksJbNb8/s1600/03.png>
Mobile
Fusioncharts and Highcharts only support html. VanCharts supports two
ways of integration in mobile terminals: web and native. Aside from JS
chart library, VanCharts also supplies IOS and Android native charts
library for users to integrate into native apps.
Licensing
Fusioncharts development and testing licenses are free. Non
watermarked product version free for non commercial use. Deployment
licenses start at $399. Per-developer licensing fee starts $390 per
developer. VanCharts can free download and use all products for study,
research or any non-profit project. Deployment licenses start at $90. Purchase
a commercial license <http://www.vancharts.com/buy.html>. Highcharts
website licenses at $90 and non-commercial usage is free.
Support
VanCharts can support free for 1 year or unlimited. Fusioncharts and
Highcharts all need pay for it.
--
You received this message because you are subscribed to the Google Groups
"Google Visualization API" group.
To unsubscribe from this group and stop receiving emails from it, send an email
to [email protected].
To post to this group, send email to [email protected].
Visit this group at http://groups.google.com/group/google-visualization-api.
For more options, visit https://groups.google.com/d/optout.