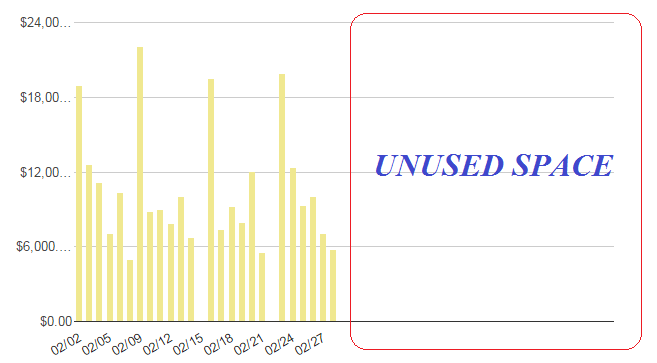
For some reason I can't get my column bars to expand across the entire
chart area. Notice in the screenshot below that the columns only occupy
half the space of the chart area. As more data points (and columns) are
added, the columns simply get squeezed together, rather than expand across
the entire width of the chart area. My chart options are shown below. How
do I format the chart so that the entire chart area is used?
 var options =
 {
  width: 1150,
  height: 400,
  bar: {groupWidth: "61.8%"},
  legend: {position: "none"},
  vAxis: {format:'currency'},
  chartArea:{left:'10%',top:'5%',width:'100%',height:'75%'},
 };

<https://lh3.googleusercontent.com/-l8Uv5hUS4F8/VhcO4cF7HOI/AAAAAAAAARg/CoTJDURcbkQ/s1600/columnChartIssue.png>

--
You received this message because you are subscribed to the Google Groups
"Google Visualization API" group.
To unsubscribe from this group and stop receiving emails from it, send an email
to [email protected].
To post to this group, send email to [email protected].
Visit this group at http://groups.google.com/group/google-visualization-api.
To view this discussion on the web visit
https://groups.google.com/d/msgid/google-visualization-api/34d07743-8e57-4b7e-896e-e95a11b81248%40googlegroups.com.
For more options, visit https://groups.google.com/d/optout.