<https://lh3.googleusercontent.com/-xx85wrGUVQk/VlQJiZud5oI/AAAAAAAAAAc/-J_iCUio3LI/s1600/plot.png>
Hi Google Visualization Community,
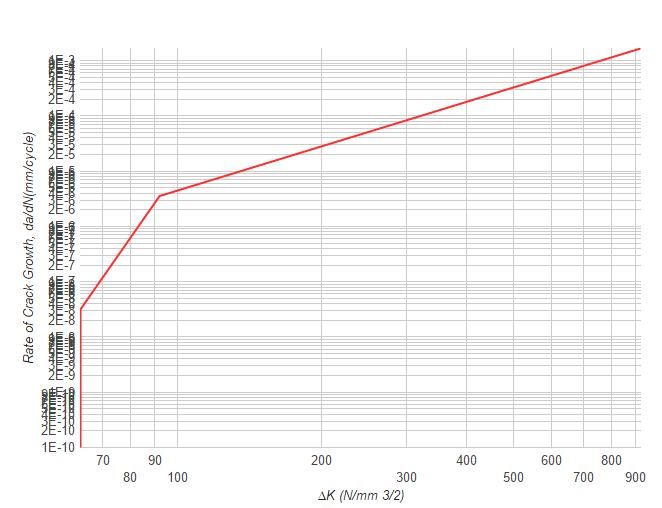
I am facing an issue with logScale labels. Labels are overlapping each
others and are not readable. Is there any way to restrict number of labels
to be drawn on the axis. I am using scientific notation for y-axis and also
want to specify ticks as well. I need grid lines to be drawn. Please see
the attached snapshot.
options :{
vAxis: {
ticks: [ 1.00E-30, 2.00E-30, 3.00E-30, 4.00E-30, 5.00E-30,
6.00E-30, 7.00E-30, ........],
logScale: true,
title: 'y-axis',
format: 'scientific',
},
}
--
You received this message because you are subscribed to the Google Groups
"Google Visualization API" group.
To unsubscribe from this group and stop receiving emails from it, send an email
to [email protected].
To post to this group, send email to [email protected].
Visit this group at http://groups.google.com/group/google-visualization-api.
To view this discussion on the web visit
https://groups.google.com/d/msgid/google-visualization-api/a17047e7-3a99-4d1c-a82f-e05532d0dddd%40googlegroups.com.
For more options, visit https://groups.google.com/d/optout.