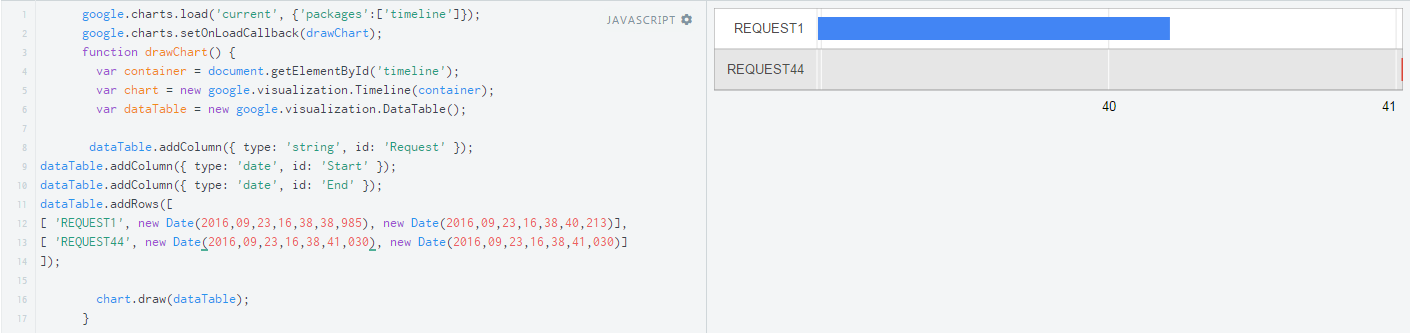
Hi,

The "Timeline chart" is having issues calculating and plotting the chart.
The code:

*'REQUEST44', new Date(2016,09,23,16,38,41,030), new
Date(2016,09,23,16,38,41,030)]* works fine but *'REQUEST44', new
Date(2016,09,23,16,38,41,028), new Date(2016,09,23,16,38,41,030)]* throws
the below issue. I am not sure if I am missing anything here.


Issue:

<https://lh3.googleusercontent.com/-ZaUJDtrS_qc/V-Vn-0aVP7I/AAAAAAAACFA/21QibERdOrcPn9Ns_TaJQRA1iuEMx71mACLcB/s1600/TimeLineChart.png>

Works Fine:

<https://lh3.googleusercontent.com/-uZETmLmFe6k/V-VoiE2--9I/AAAAAAAACFE/GYgb4a577Uw2zSD3TpptrBciSeemd7OUwCLcB/s1600/TimeLineChartFine.png>

--
You received this message because you are subscribed to the Google Groups
"Google Visualization API" group.
To unsubscribe from this group and stop receiving emails from it, send an email
to [email protected].
To post to this group, send email to [email protected].
Visit this group at https://groups.google.com/group/google-visualization-api.
To view this discussion on the web visit
https://groups.google.com/d/msgid/google-visualization-api/3923f3e4-4c81-48e3-a96f-0bbbedc571db%40googlegroups.com.
For more options, visit https://groups.google.com/d/optout.