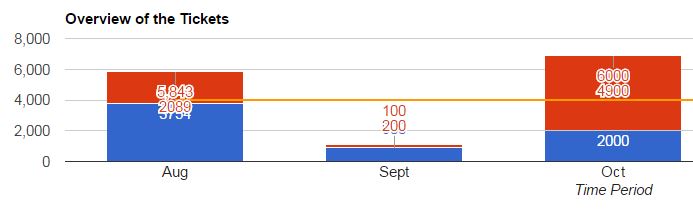
I'm creating a stacked bar graph and need to show the label inside the
stack. But Few of the label's are getting overlapped. for reference
<https://lh3.googleusercontent.com/-E_ozYkIaGDk/V-0Q--tc7AI/AAAAAAAAAD4/k1Ju98E8dwslxLCjZ2UbXX7csrR8Fe6SQCLcB/s1600/Overlap.JPG>

Can you please help me how to avoid overlapping using google charts ?


Source code :

<html>

<head>

<script type="text/javascript"
src="https://www.gstatic.com/charts/loader.js";></script>

  <div id="chart_div"></div>

 <script type="text/javascript">

  google.charts.load('current', {packages: ['corechart', 'bar']});

  google.charts.setOnLoadCallback(drawStacked);


function drawStacked() {

      var data = new google.visualization.arrayToDataTable([['Time
Period','XYZ',{ role: 'annotation'},'ABC',{ role: 'annotation'},{ role:
'annotation'},'Average'],

        ['Aug', 3754,'3754', 2089,'2089','5,843',4000],

        ['Sept', 900,'900', 200,'200', '100',4000],

['Oct', 2000,'2000', 4900,'4900', '6000',4000],

['Nov', 1700,'1700', 2200,'2200', '3900',4000],

['Dec', 2400,'2400', 2089,'2200', '4600',4000]

      ]);


      var options = {

        title: 'Overview of the Tickets',

        isStacked: true,

orientation: 'horizontal',

        hAxis: {

          title: 'Time Period',

          annotations: {}

           },

        vAxis: {

          title: 'Number of Tickets'

        },

seriesType: 'bars',

      series: {2: {type: 'line'}}

      };


      var chart = new
google.visualization.ComboChart(document.getElementById('chart_div'));

      chart.draw(data, options);

    }

  </script>

</head>


</html>


Regards,

Srikanth D

--
You received this message because you are subscribed to the Google Groups
"Google Visualization API" group.
To unsubscribe from this group and stop receiving emails from it, send an email
to [email protected].
To post to this group, send email to [email protected].
Visit this group at https://groups.google.com/group/google-visualization-api.
To view this discussion on the web visit
https://groups.google.com/d/msgid/google-visualization-api/67ae2e19-286a-4803-beea-8ba542635665%40googlegroups.com.
For more options, visit https://groups.google.com/d/optout.